Creating Employee Salary Reports
Published: July 10, 2025
Reading Time: 8 minutes
Author: The Informa Designer Team
Employee compensation tracking is a critical function for any organization. Whether you’re managing a small team or a large enterprise, having clear, well-formatted salary reports helps with budgeting, compliance, and strategic planning. In this tutorial, we’ll walk through creating a professional salary report using Informa Designer’s visual report builder.
What We’ll Build
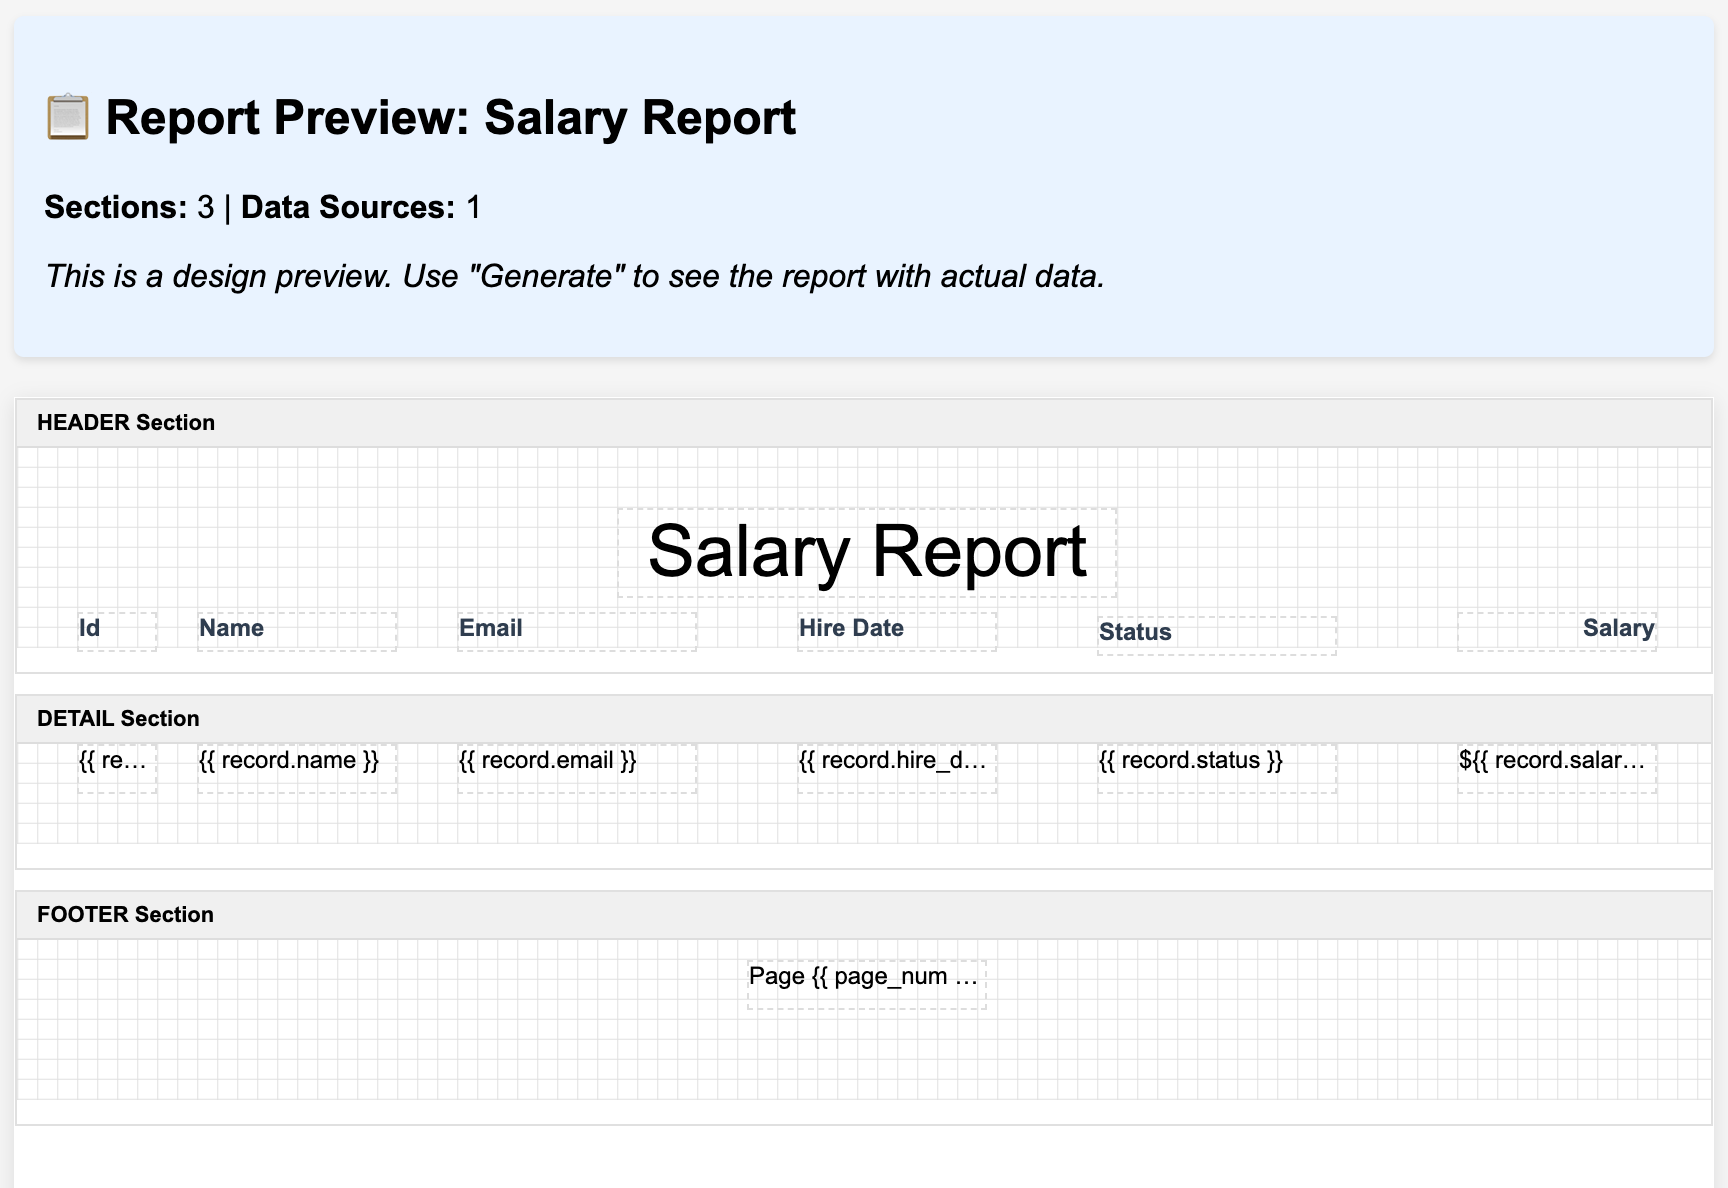
By the end of this tutorial, you’ll have created a clean, professional salary report that displays:
- Employee identification details
- Contact information
- Employment dates
- Current status
- Salary information
The report will automatically paginate for large employee lists and include professional headers and footers.

Getting Started
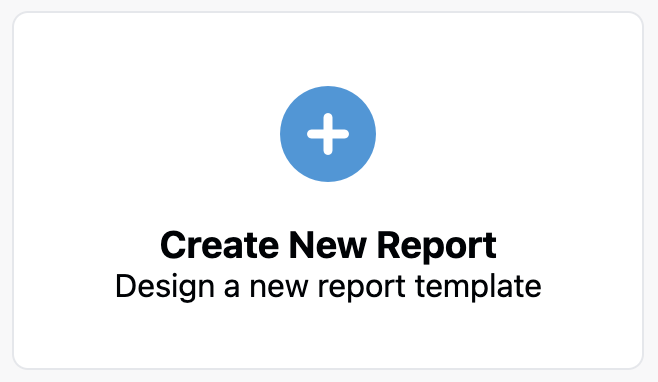
First, log into your Informa Designer account and navigate to the Report Designer. Click on “Create New Report” to begin with a blank canvas.
Step 1: Set Your Report Name
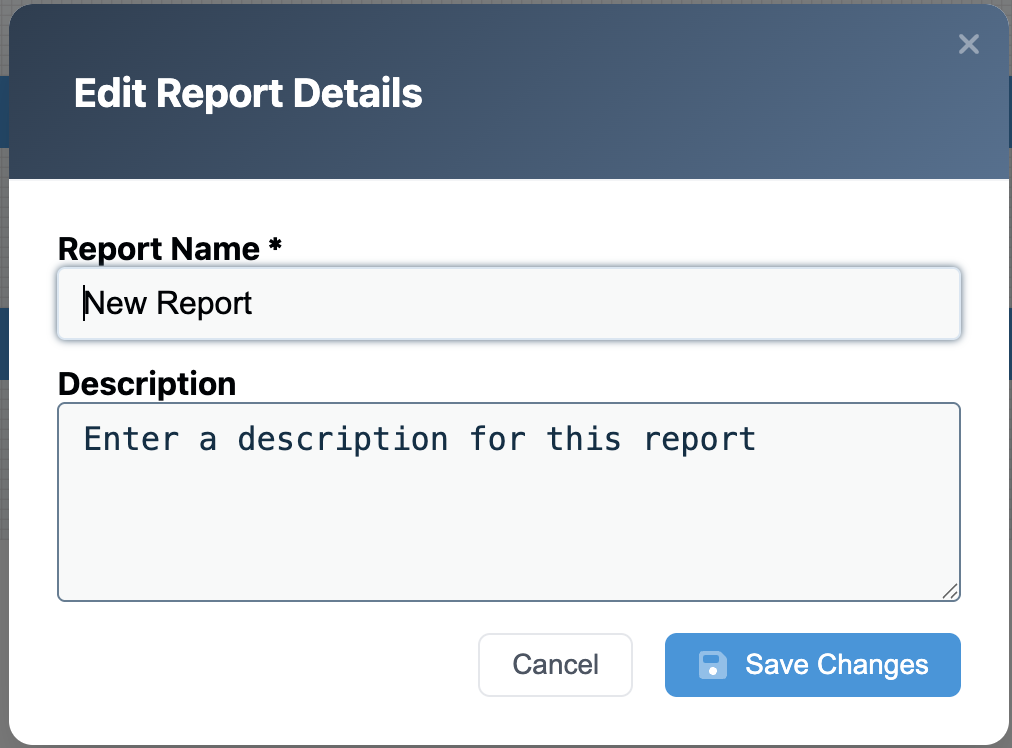
We need to give your report a name. Click on the “New Report”, to set the report name and provide a description.
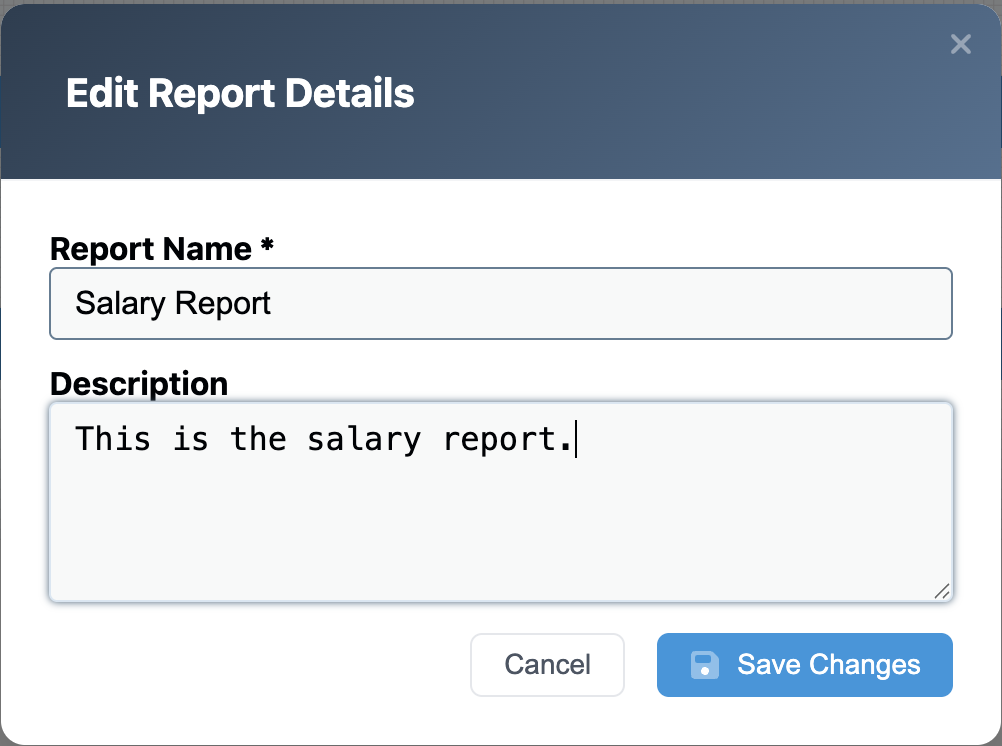
- Set the name to, “Salary Report”
- Set the description to, “This is the salary report.”
Step 2: Setting Up the Data Source
Before designing our report layout, we need to connect to our employee data. In this example, we’ll use a MongoDB collection called “employees” that contains our salary information.
- In the Report Designer, click on the Data Sources tab in the left panel
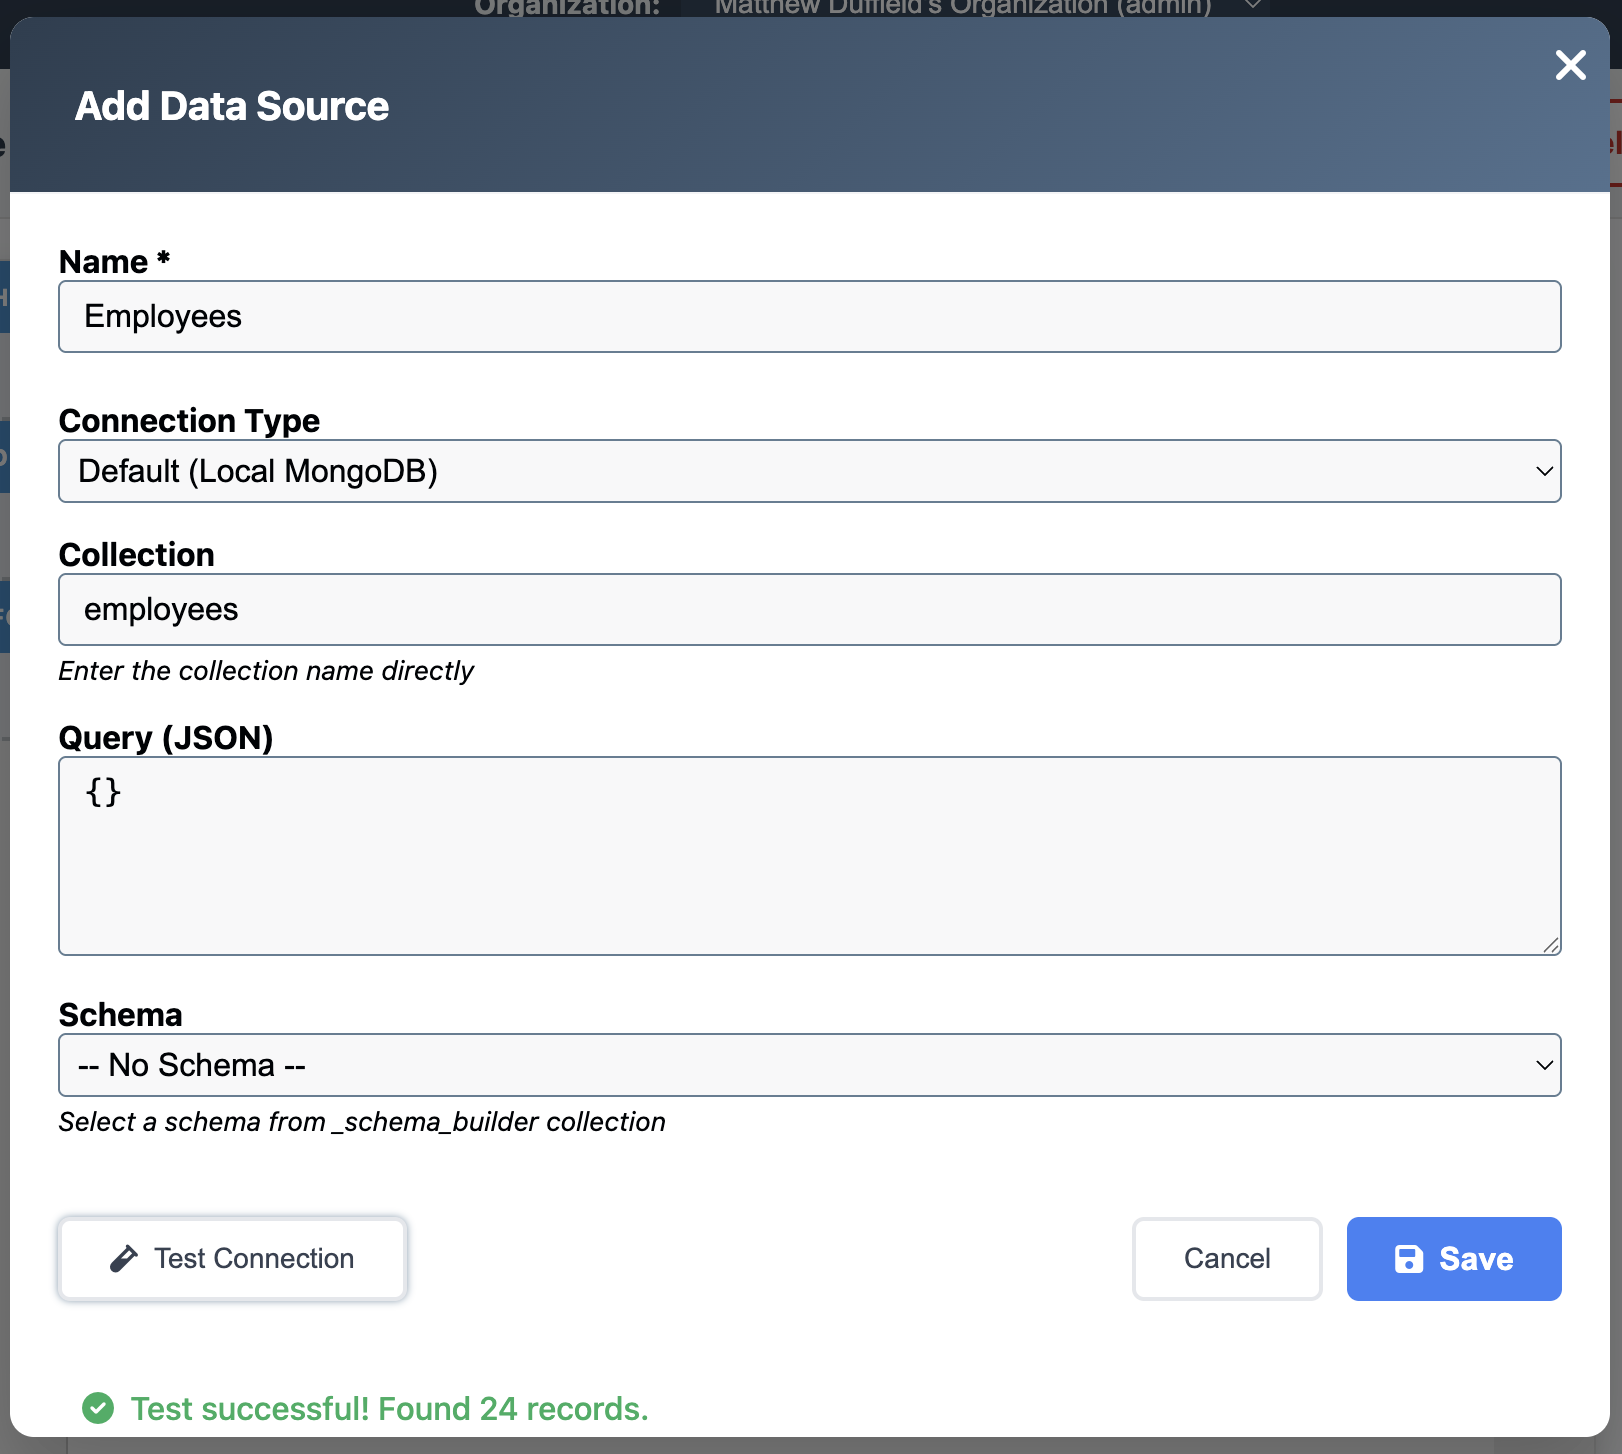
- Click “Add Data Source”
- Select MongoDB as your data source type
- Name it “Employees”
- Configure the connection:
- Collection: employees
- Query: {} (this returns all records)
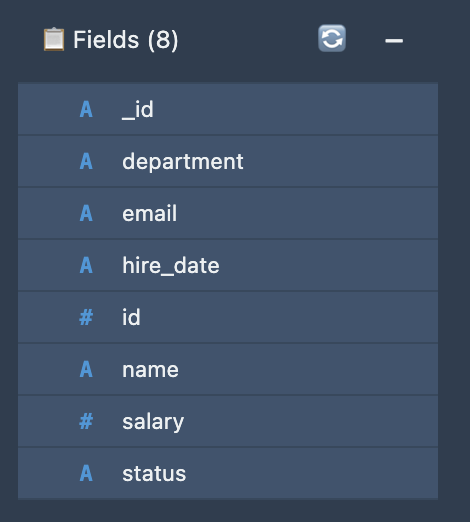
Your employee data should have the following fields: - id - Employee ID number - name - Full name - email - Email address - hire_date - Date of hiring - status - Employment status (Active, Inactive, etc.) - salary - Annual salary amount
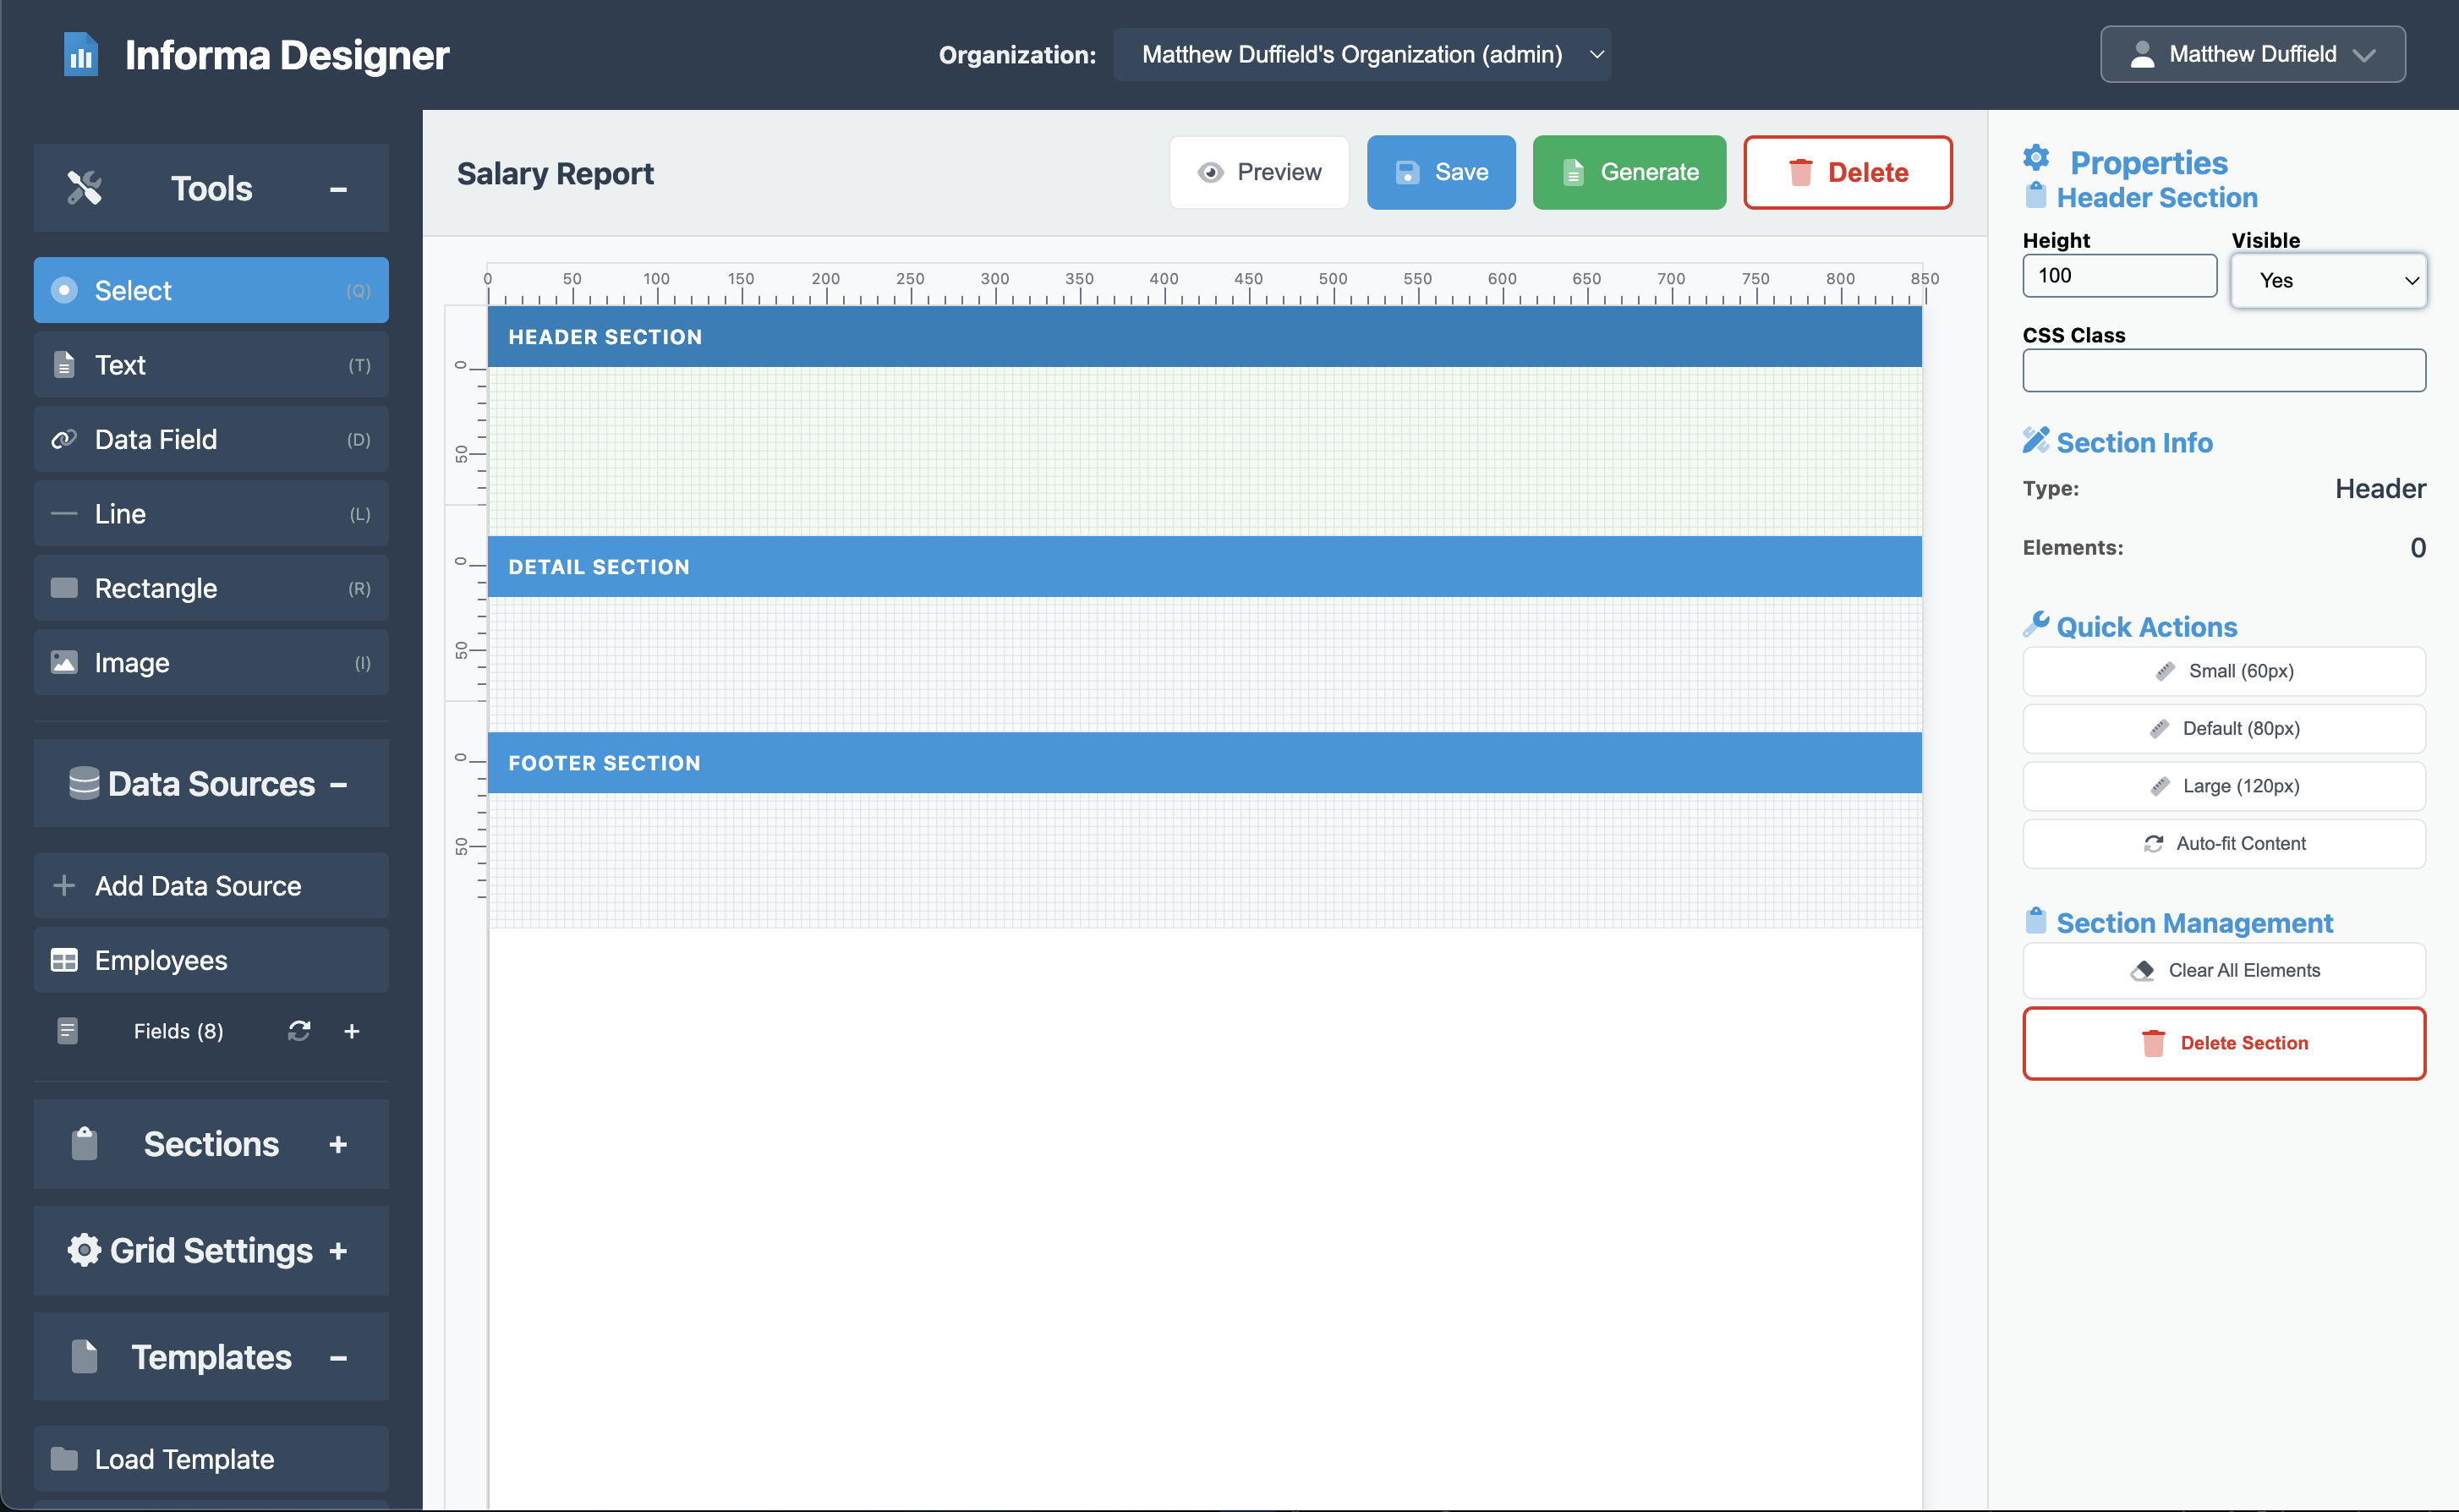
Step 3: Designing the Report Header
The header section appears at the top of every page and typically contains the report title and column headers.
Header Settings
- Click on the Header section in the design canvas
- Set the properties:
- Height: 100
- Visible: Yes
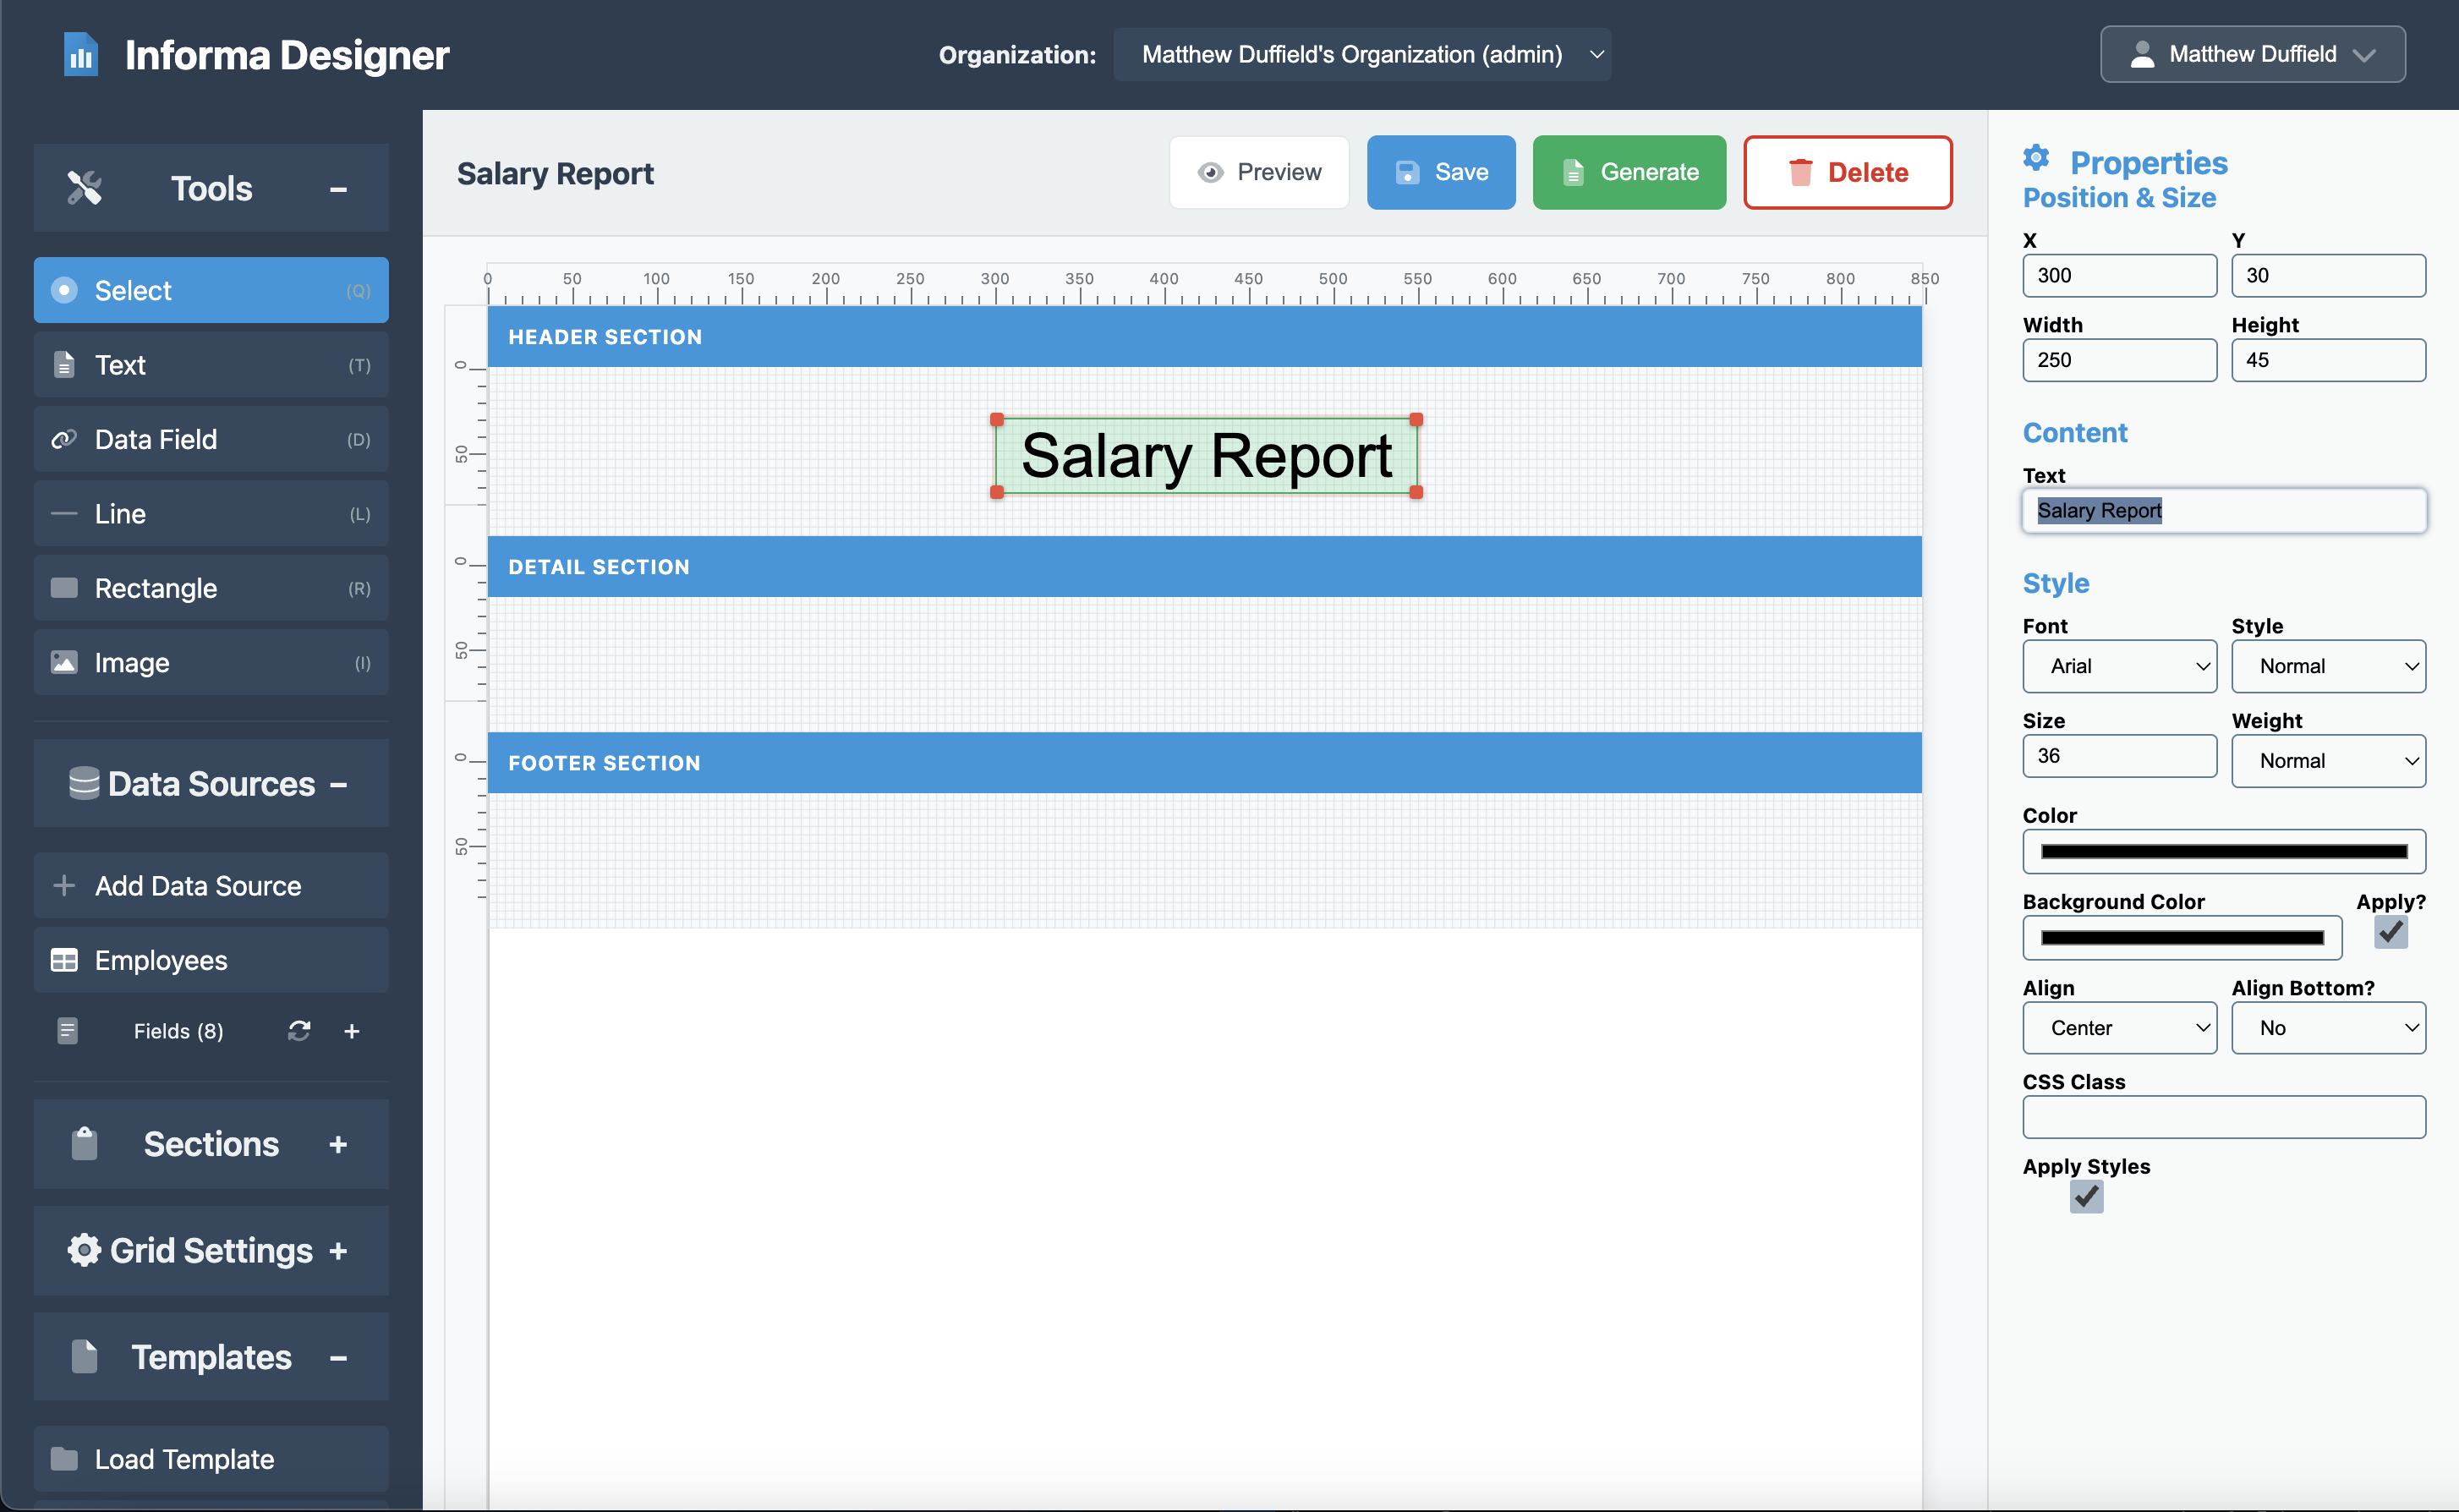
Adding the Report Title
- Click on the Text element from the toolbar and then click on the header in the canvas
- Position it at the center top of the header (x: 300, y: 30)
- Set the properties:
- Width: 250
- Height: 45
- Content: “Salary Report”
- Font Size: 36px
- Font Family: Arial
- Alignment: Center
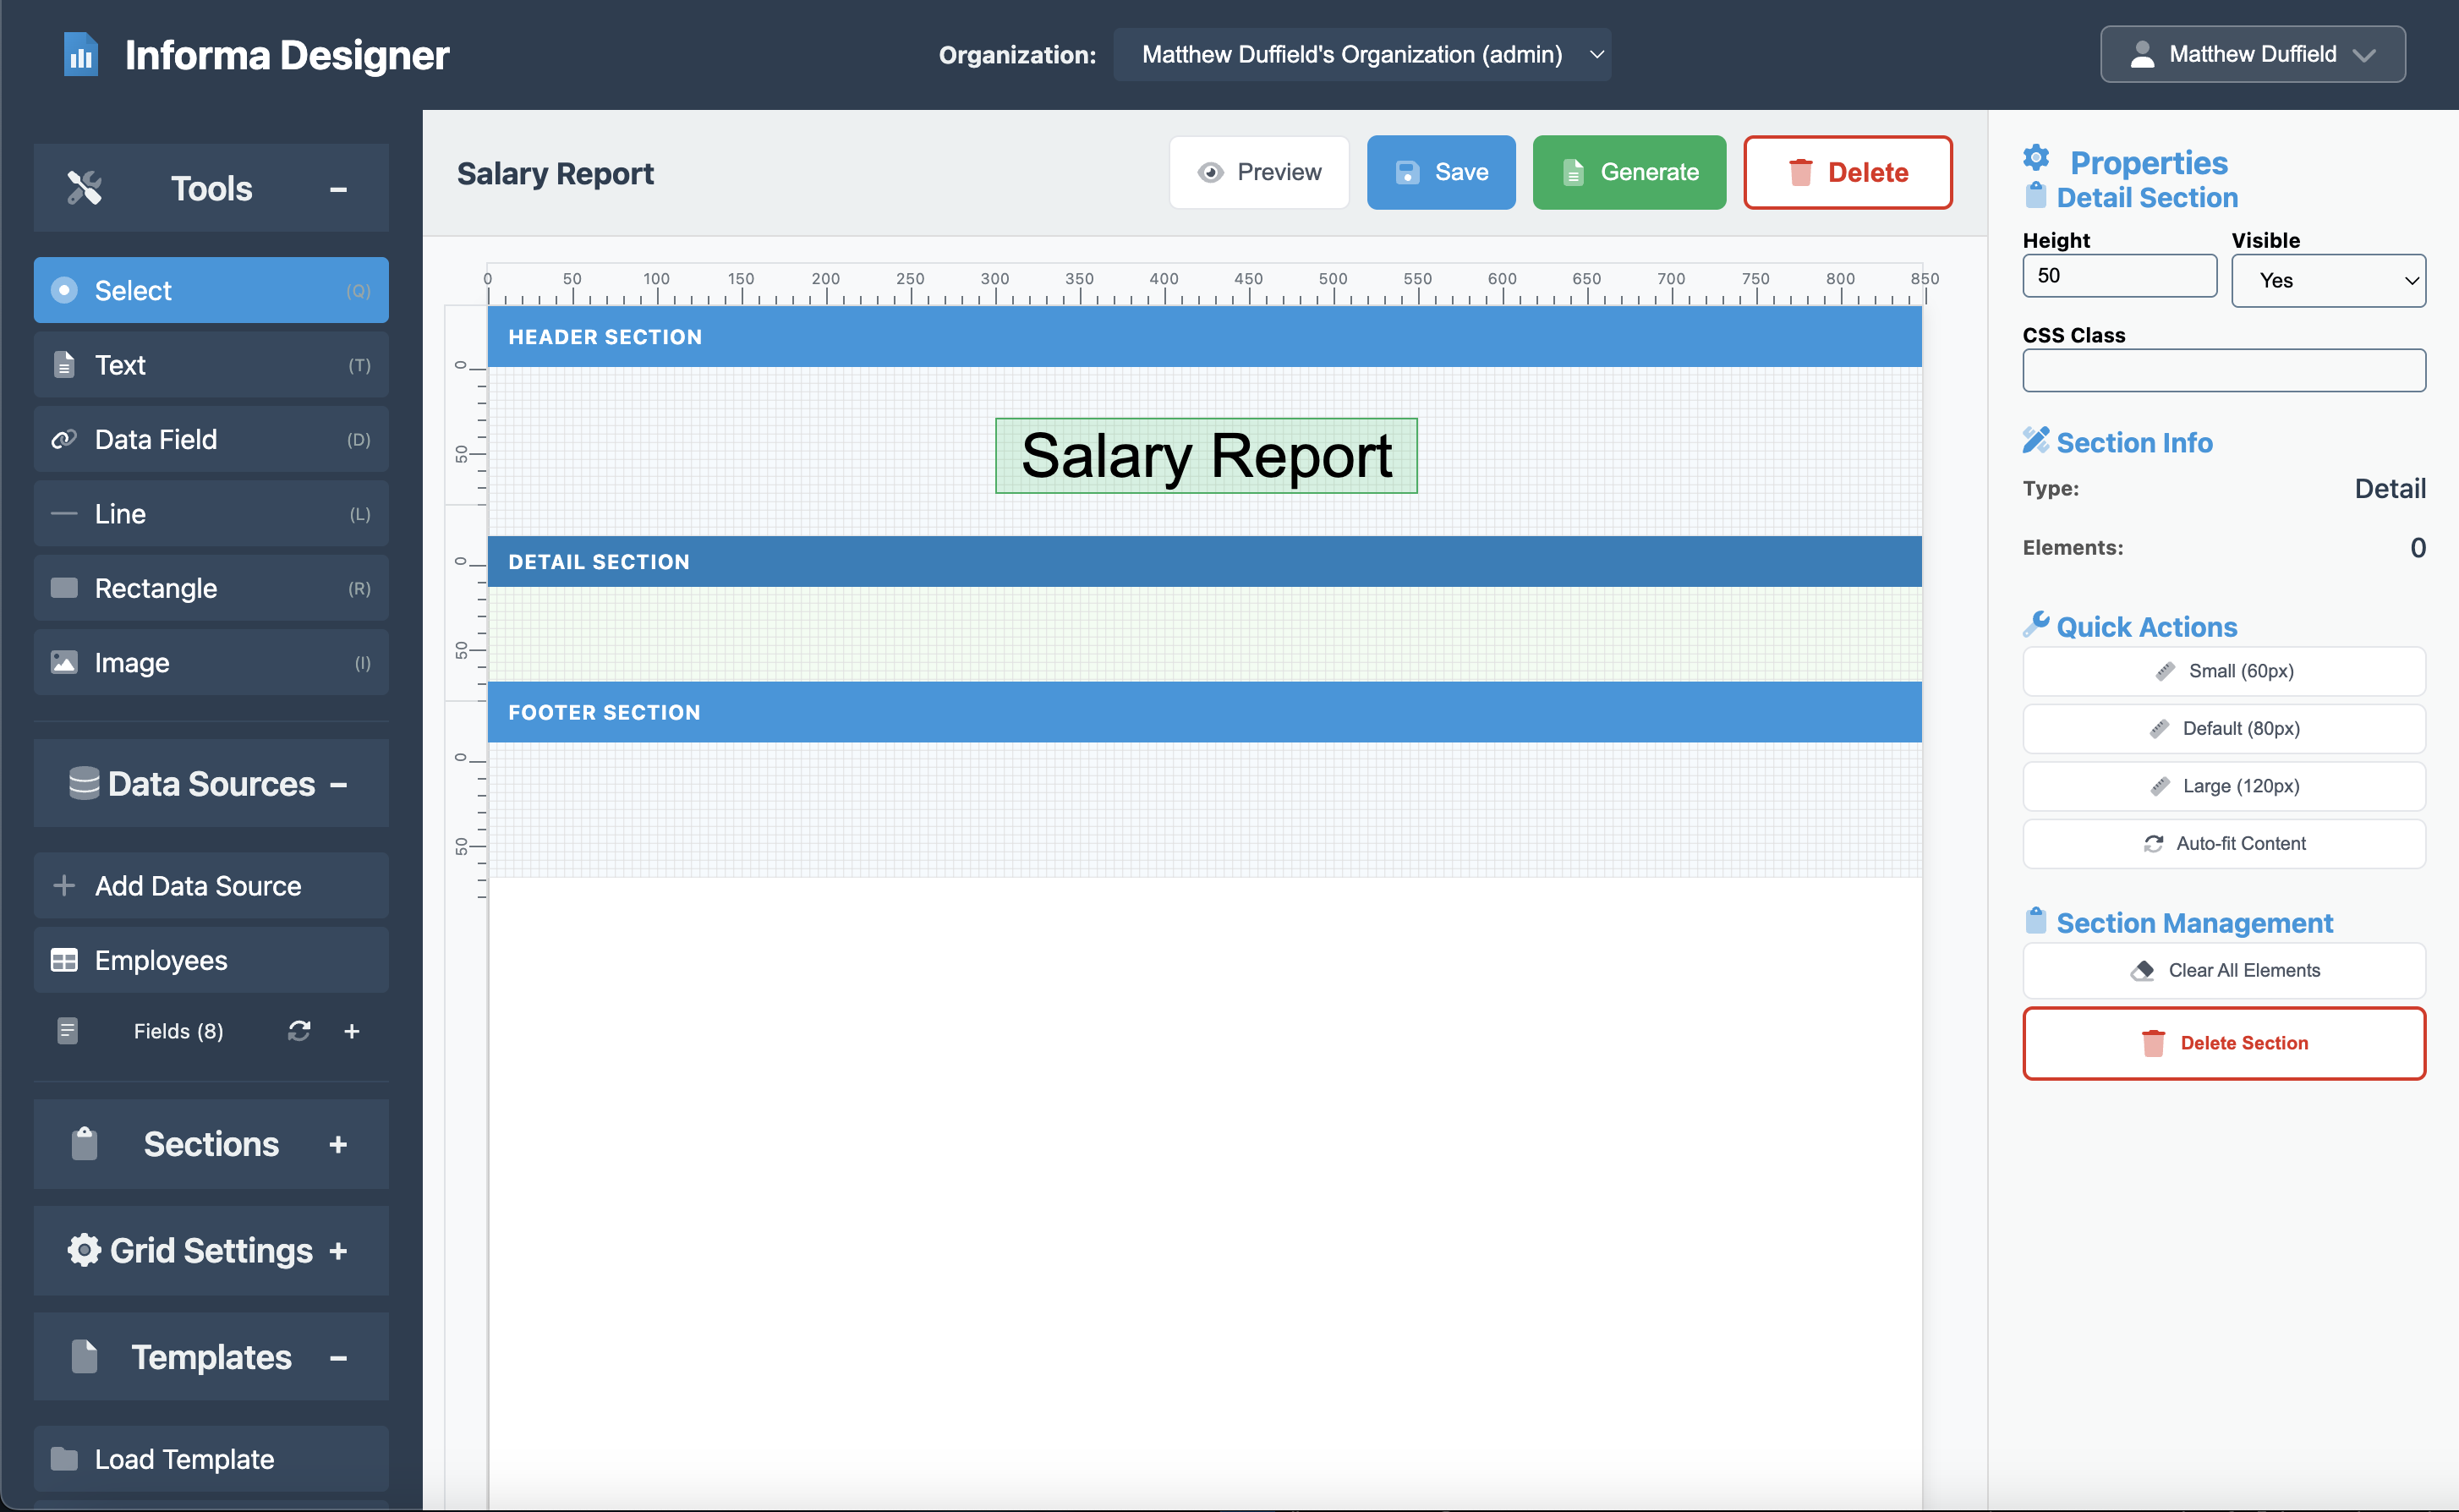
Step 4: Creating the Detail Section
The detail section is where the magic happens - it automatically repeats for each record in your data source.
Detail Settings
- Click on the Detail section
- Set the properties:
- Height: 50
- Visible: Yes
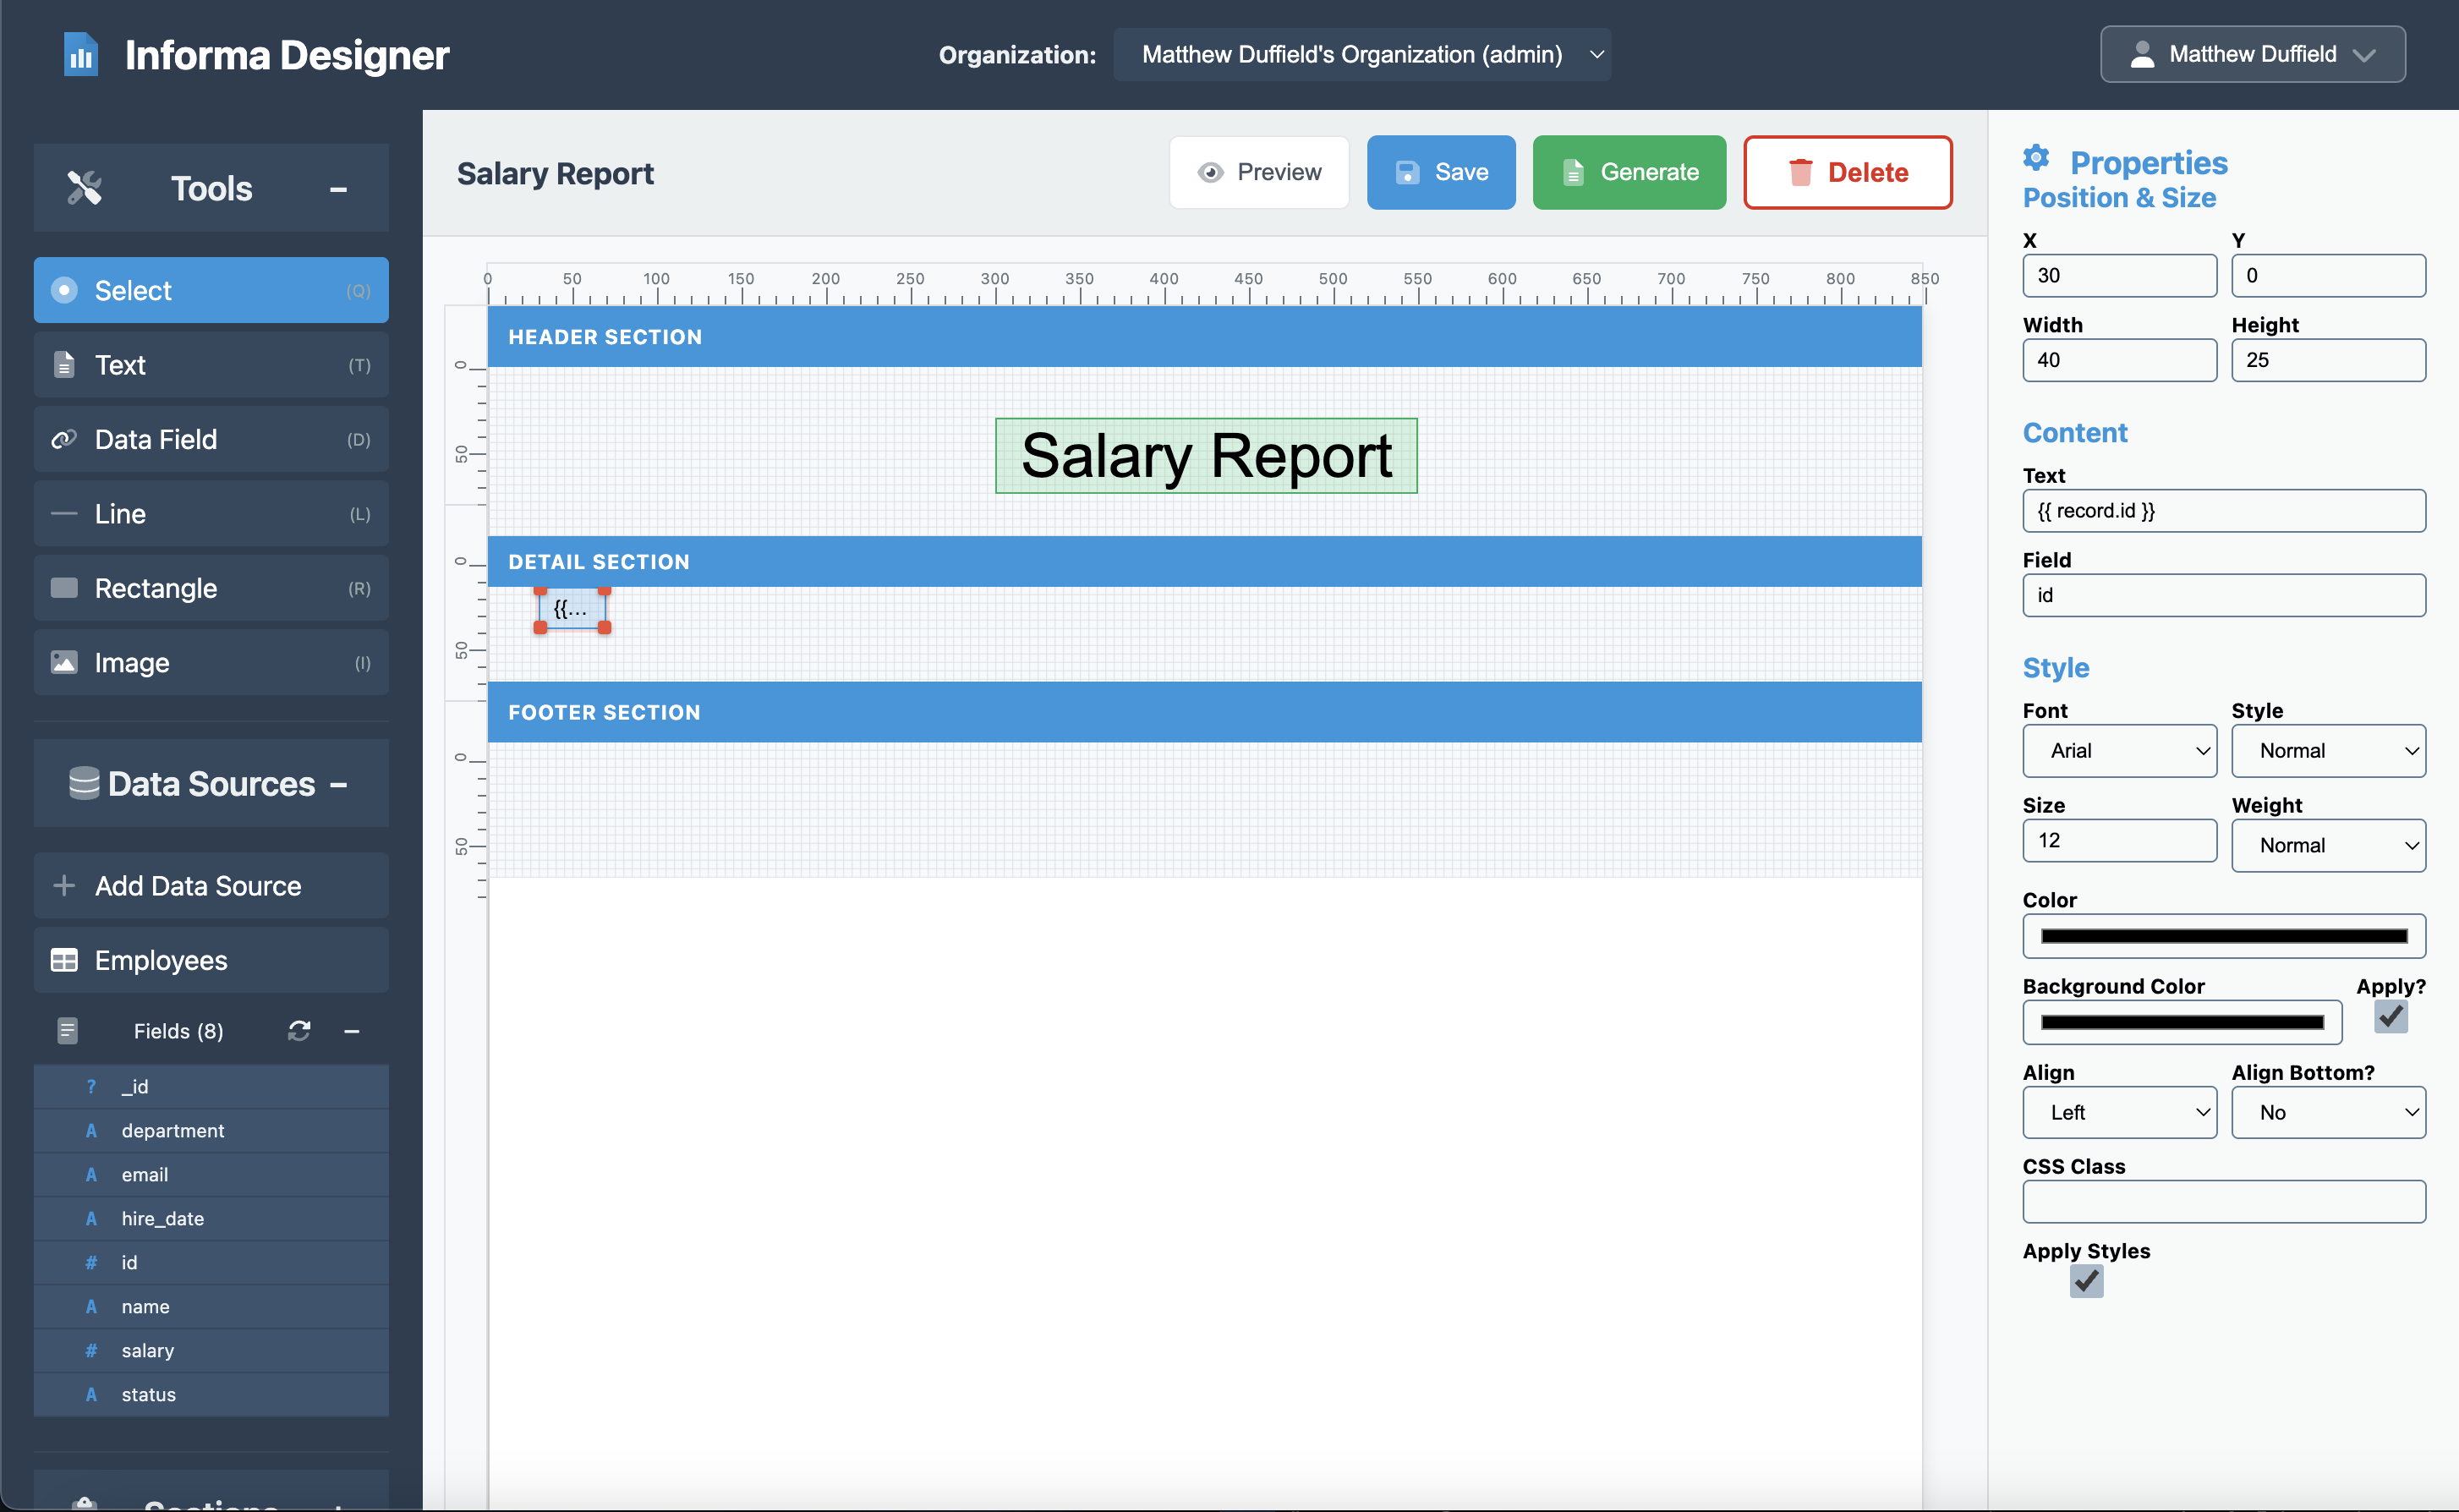
Adding Data Fields
Now click on the Fields section under the Data Sources from the left pane. Here are the steps for the employee ID:
- Drag a Field element, “id” from the toolbar
- Set the properties:
- X: 30
- Y: 0
- Width: 40
- Height: 25
- Content: {{ record.id }}
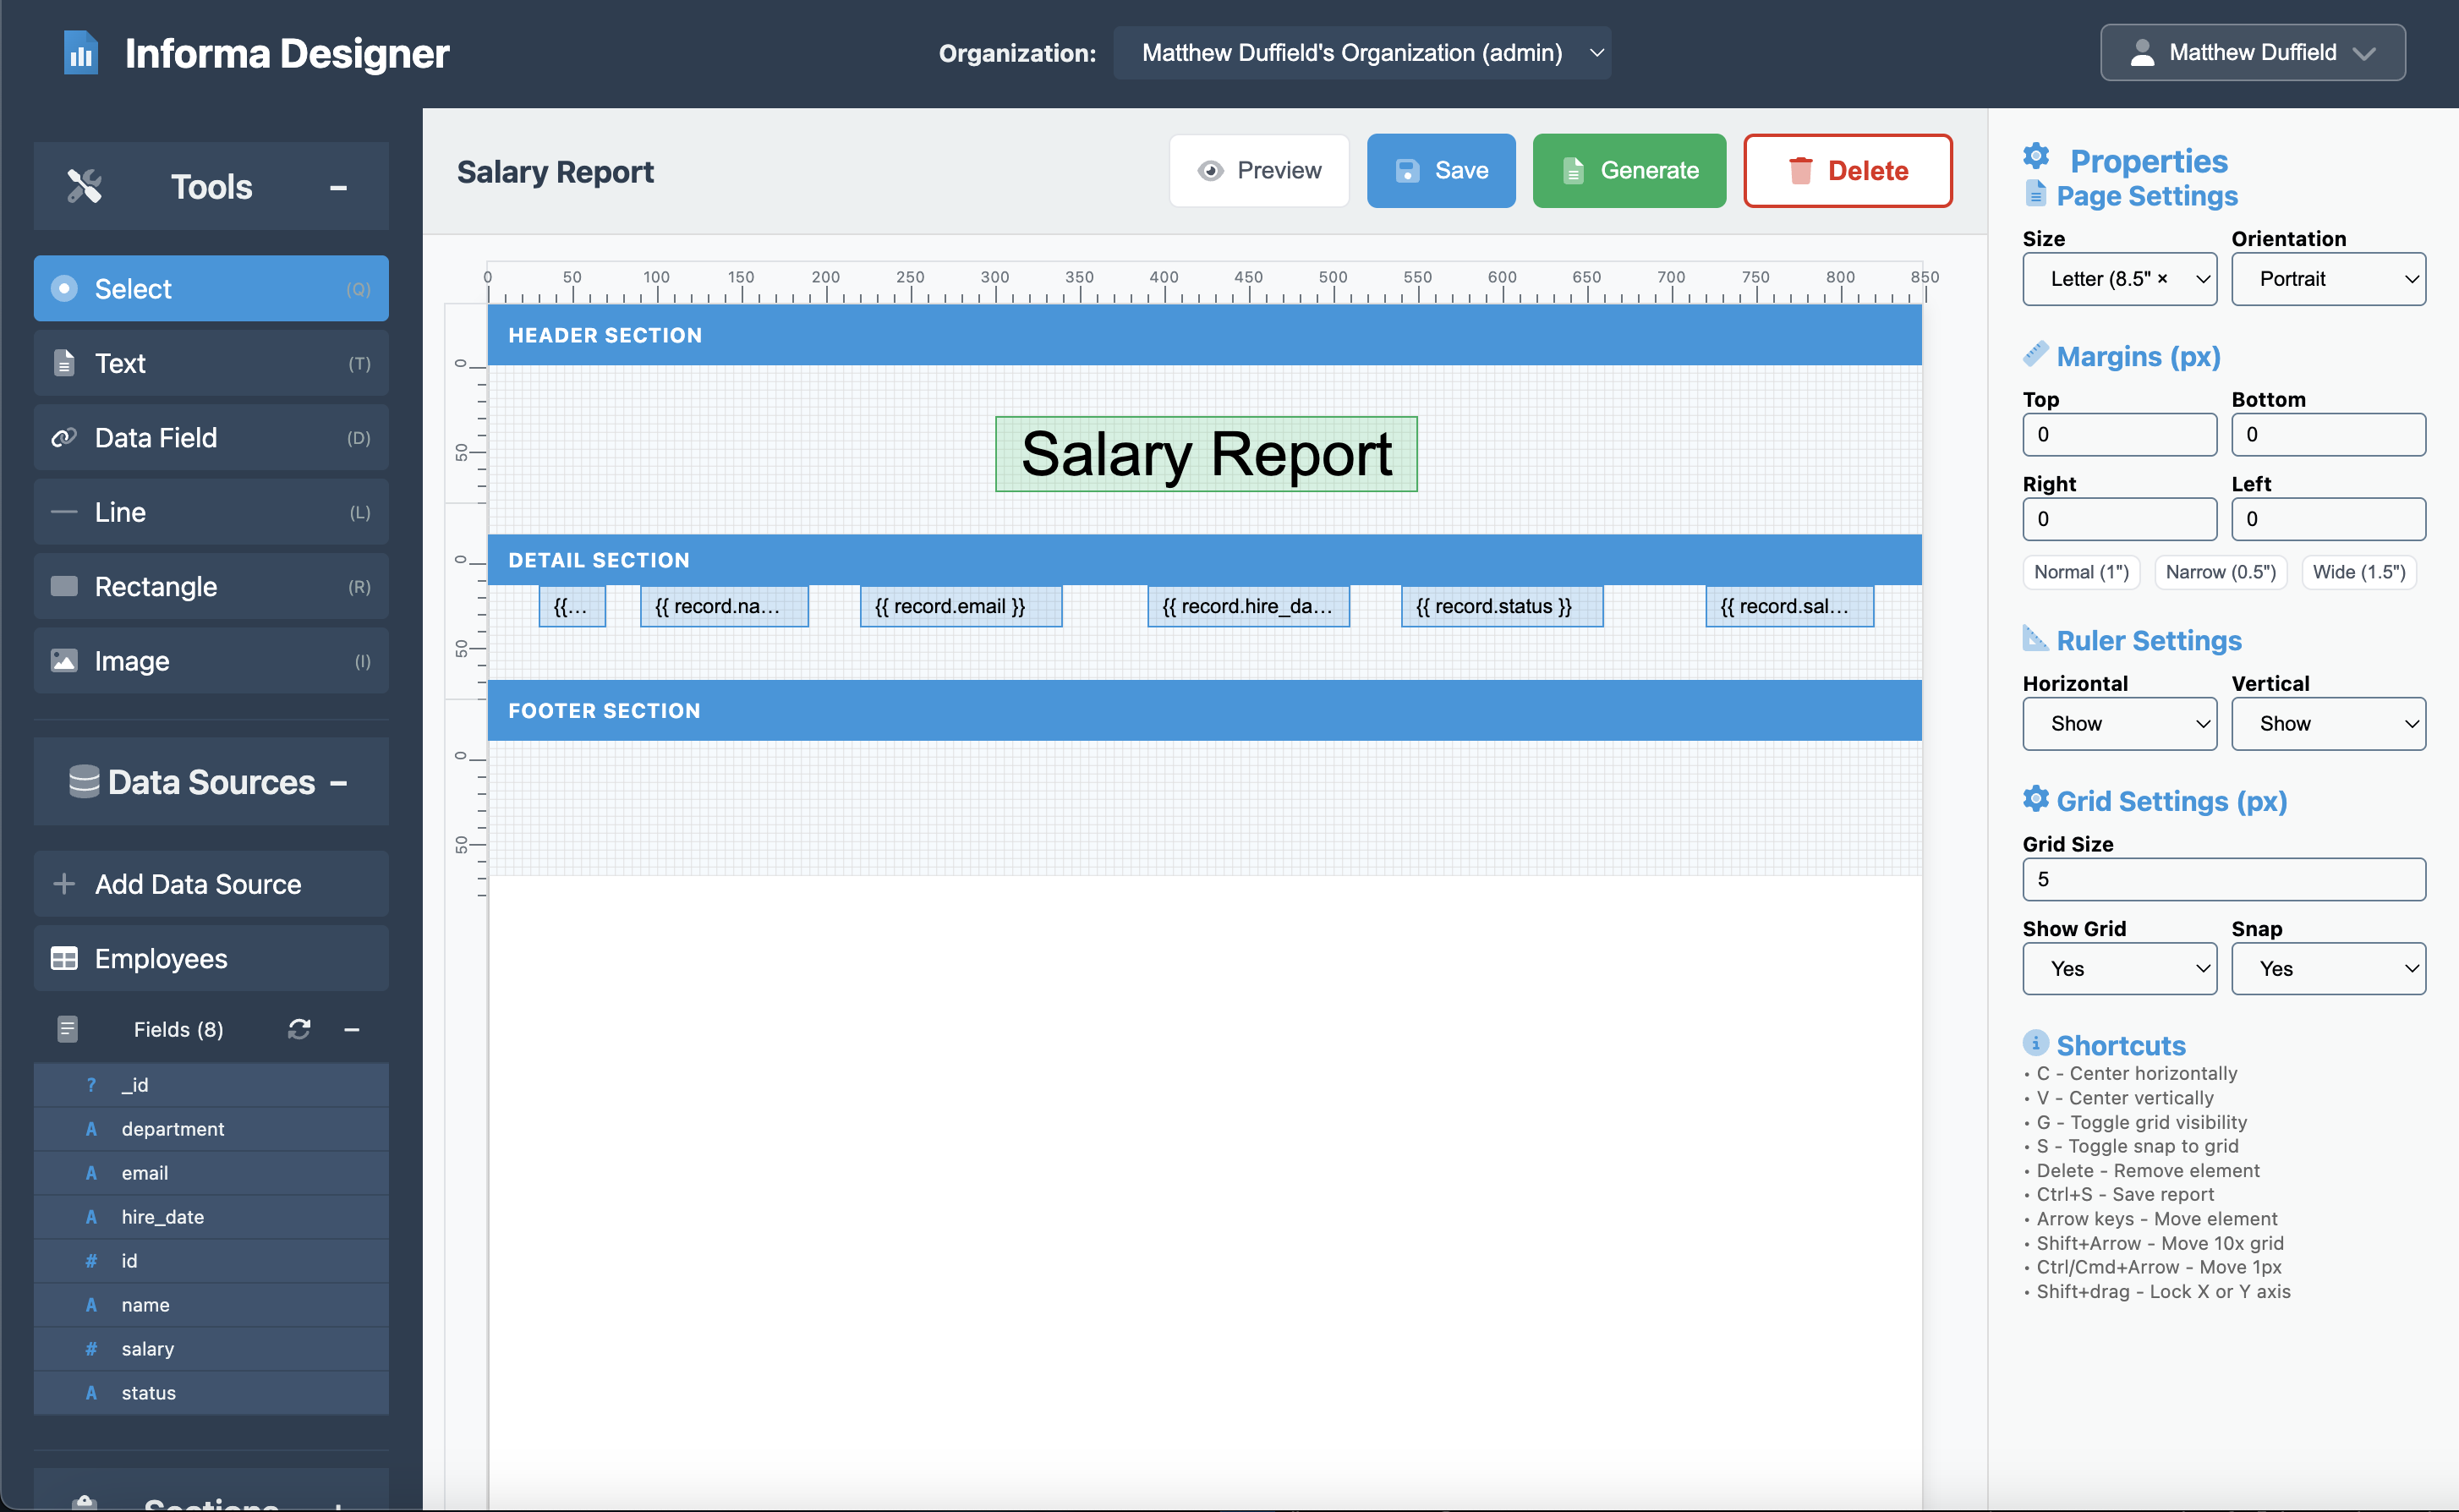
Repeat this process for each field:
| Name | Field | Content | X Pos. | Width | Alignment |
|---|---|---|---|---|---|
| Name | name | {{ record.name }} | 90 | 100 | Left |
| {{ record.email }} | 220 | 120 | Left | ||
| Hire Date | hire_date | {{ record.hire_date }} | 390 | 100 | Left |
| Status | status | {{ record.status }} | 540 | 120 | Left |
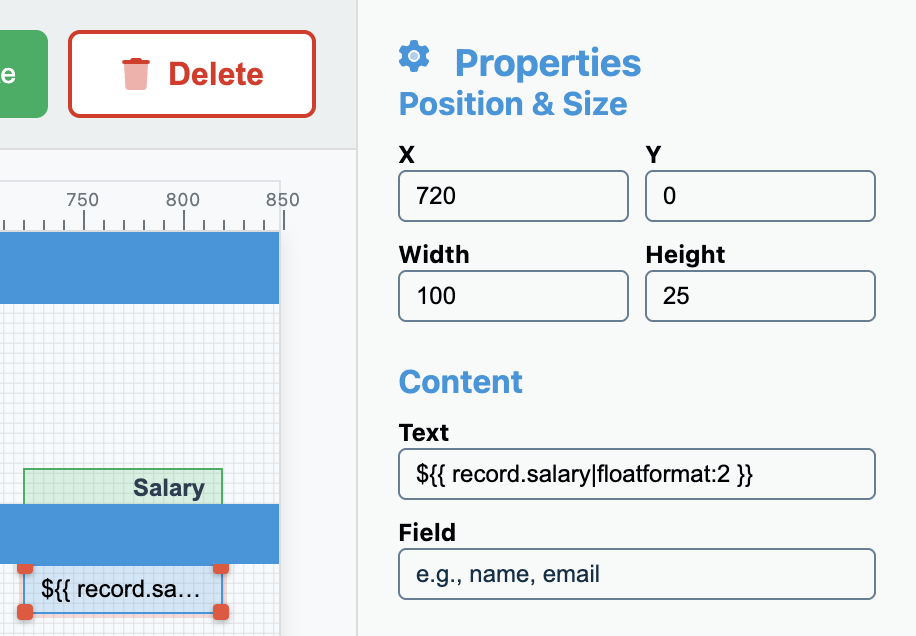
| Salary | salary | ${{ record.salary|floatformat:2 }} | 720 | 100 | Right |
NOTE: You will need to clear out the Content > Field so that it is blank for the “salary” field.
Formatting Tips
Notice the salary field uses special formatting: - The $ prefix for currency - |floatformat:2 filter to show two decimal places - Right alignment for numeric values
Step 5: Adding Column Headers
Now that we have the details in place, creating the headers is fairly easy.
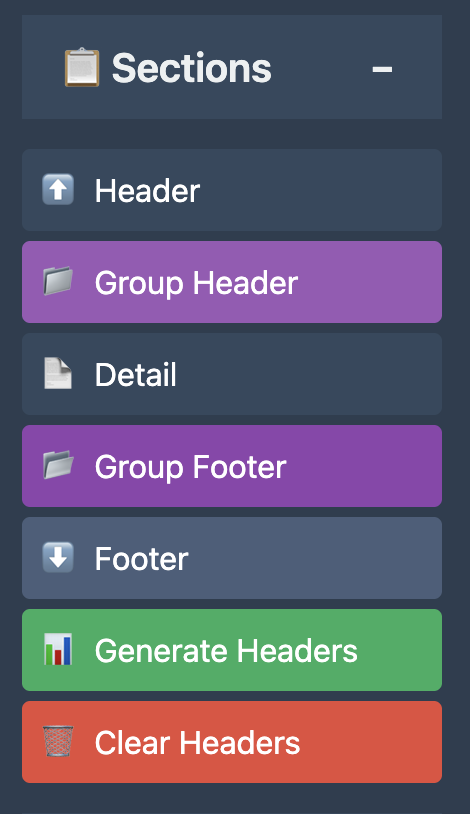
Column Headers
To add column header, simply click on the Generate Headers button.

This will generate a header for each detail field that has already been placed in the details section. Please confirm each field header setting from the table below:
| Column | Content | X Position | Width | Align |
|---|---|---|---|---|
| ID | “Id” | 30 | 40 | Left |
| Name | “Name” | 90 | 100 | Left |
| “Email” | 220 | 120 | Left | |
| Hire Date | “Hire Date” | 390 | 100 | Left |
| Status | “Status” | 540 | 120 | Left |
| Salary | “Salary” | 720 | 100 | Right |
NOTE: Since the “salary” field has a special “$” character, you will need to set the text manually.
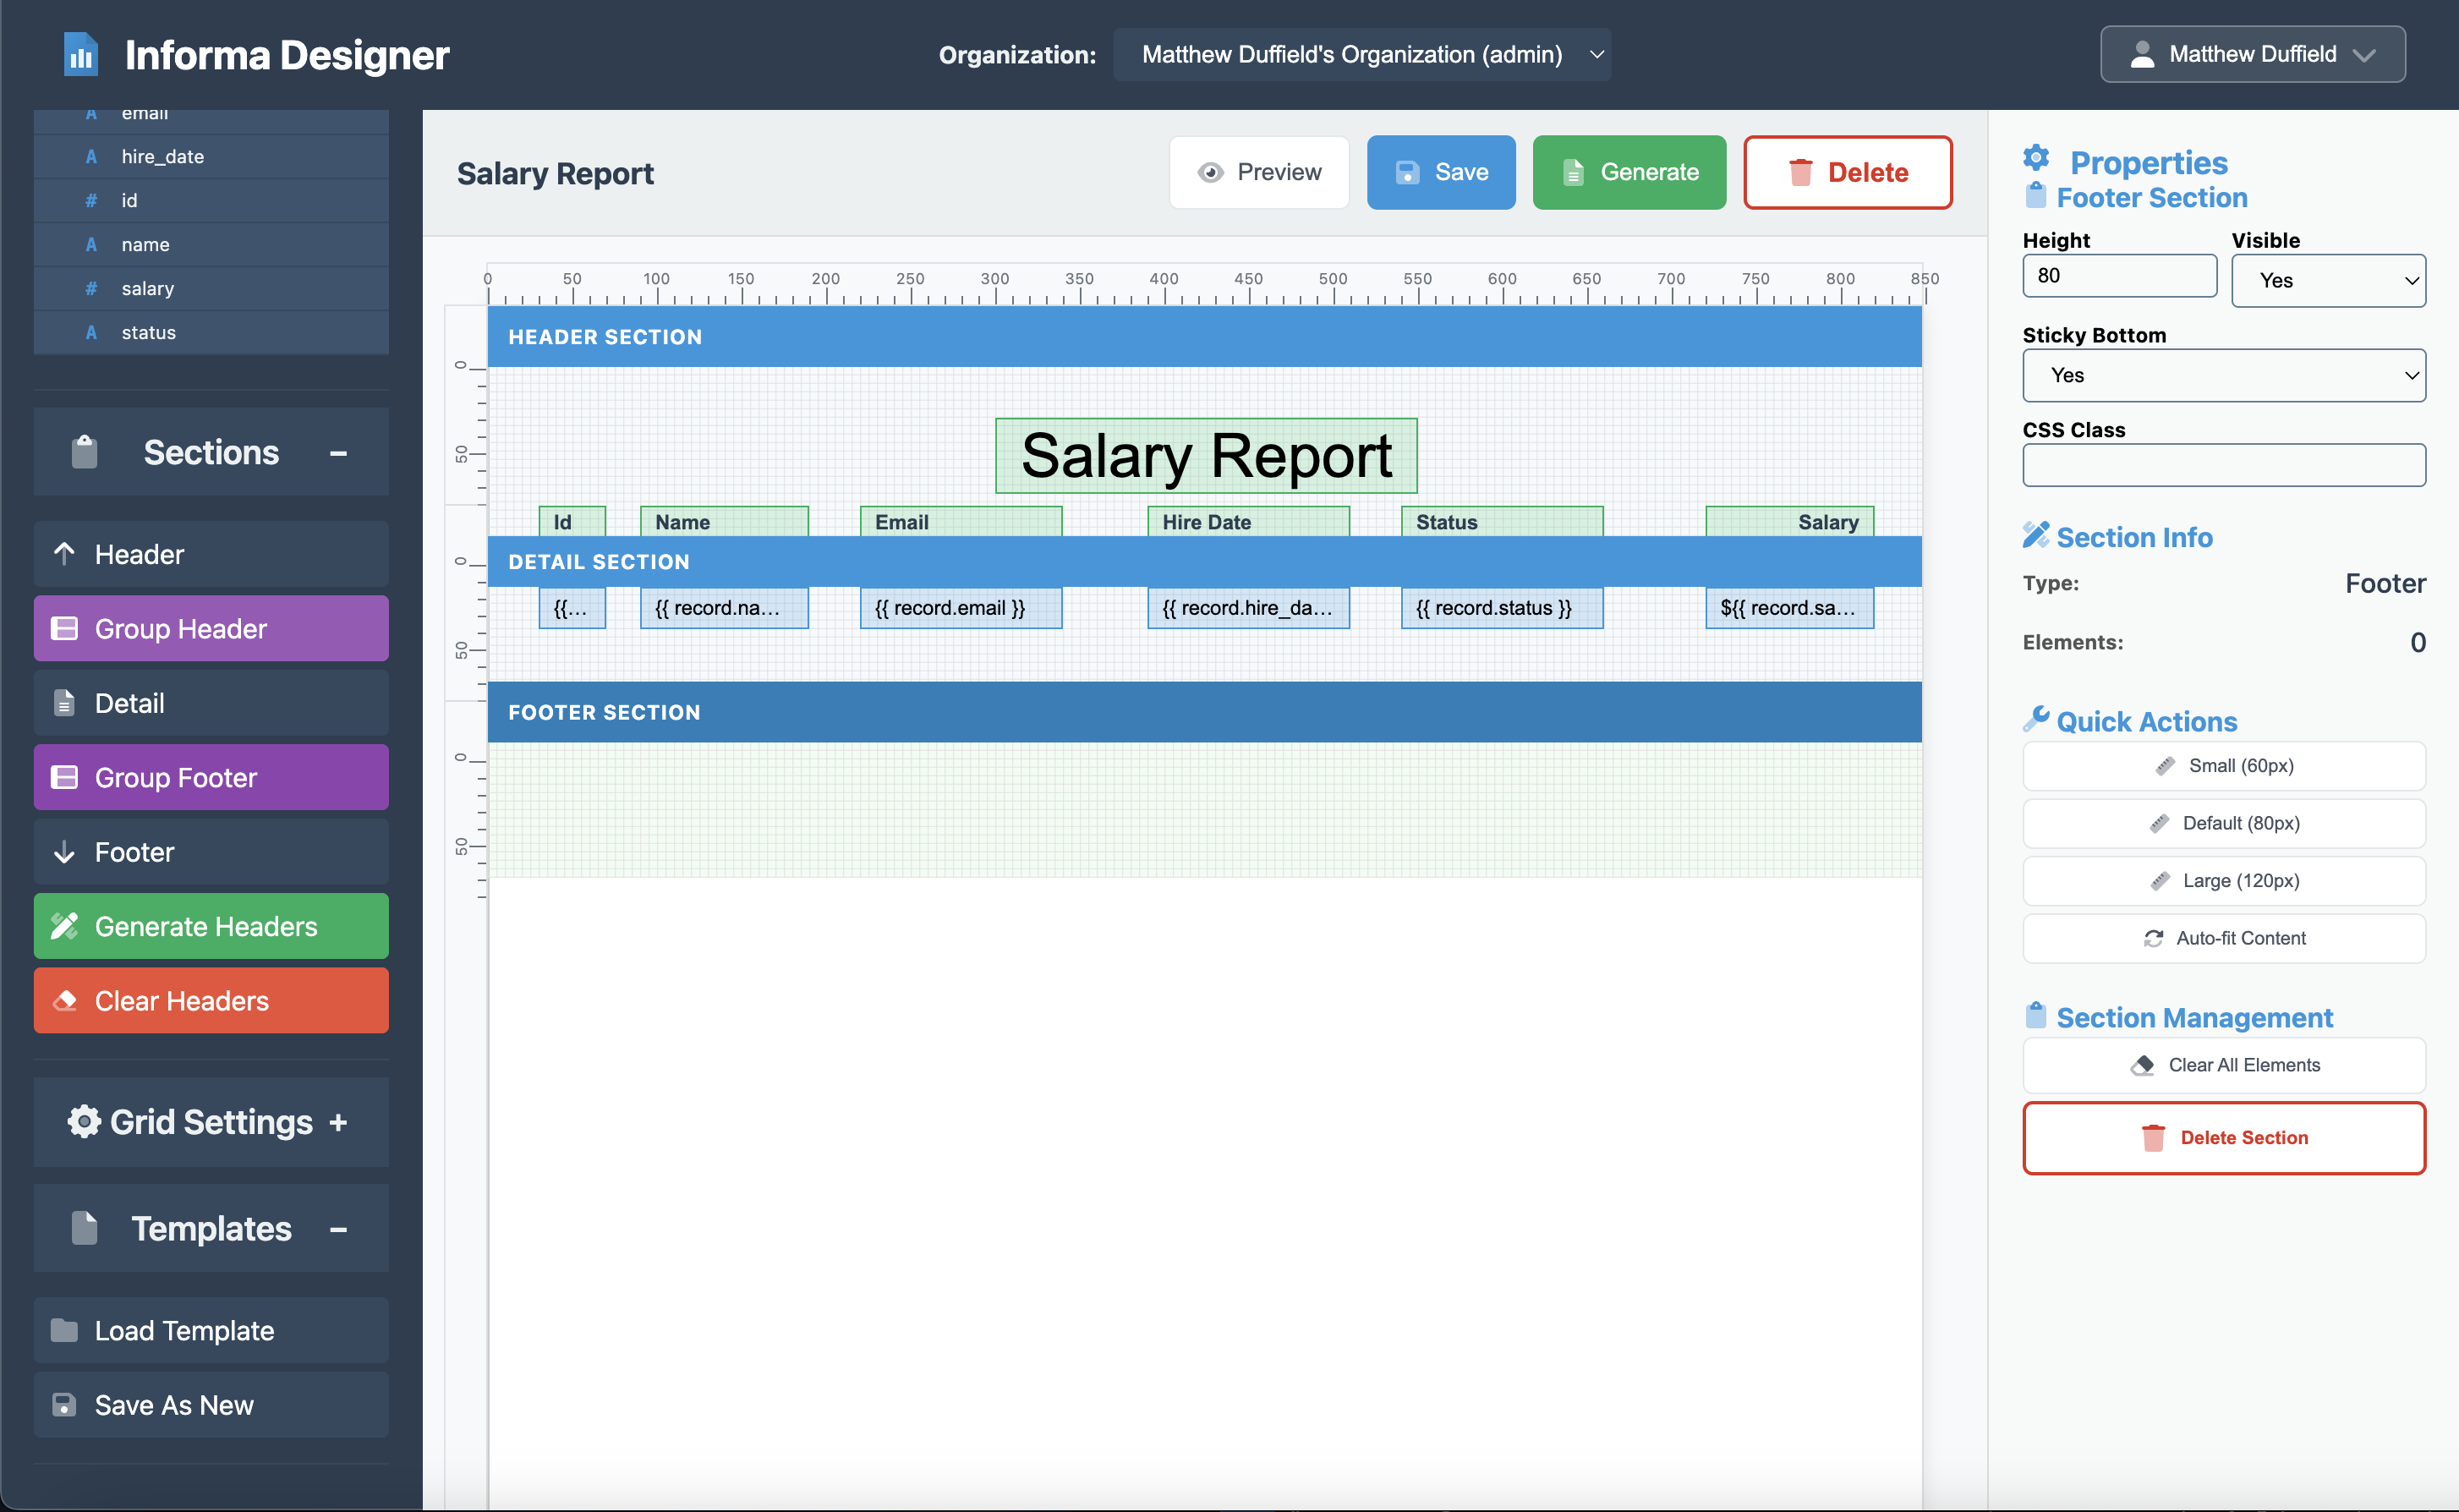
Step 6: Adding a Professional Footer
The footer appears at the bottom of each page and typically contains page numbers or other summary information.
Footer Settings
- Click on the Footer section in the design canvas
- Set the properties:
- Height: 80
- Visible: Yes
- Sticky Bottom: Yes
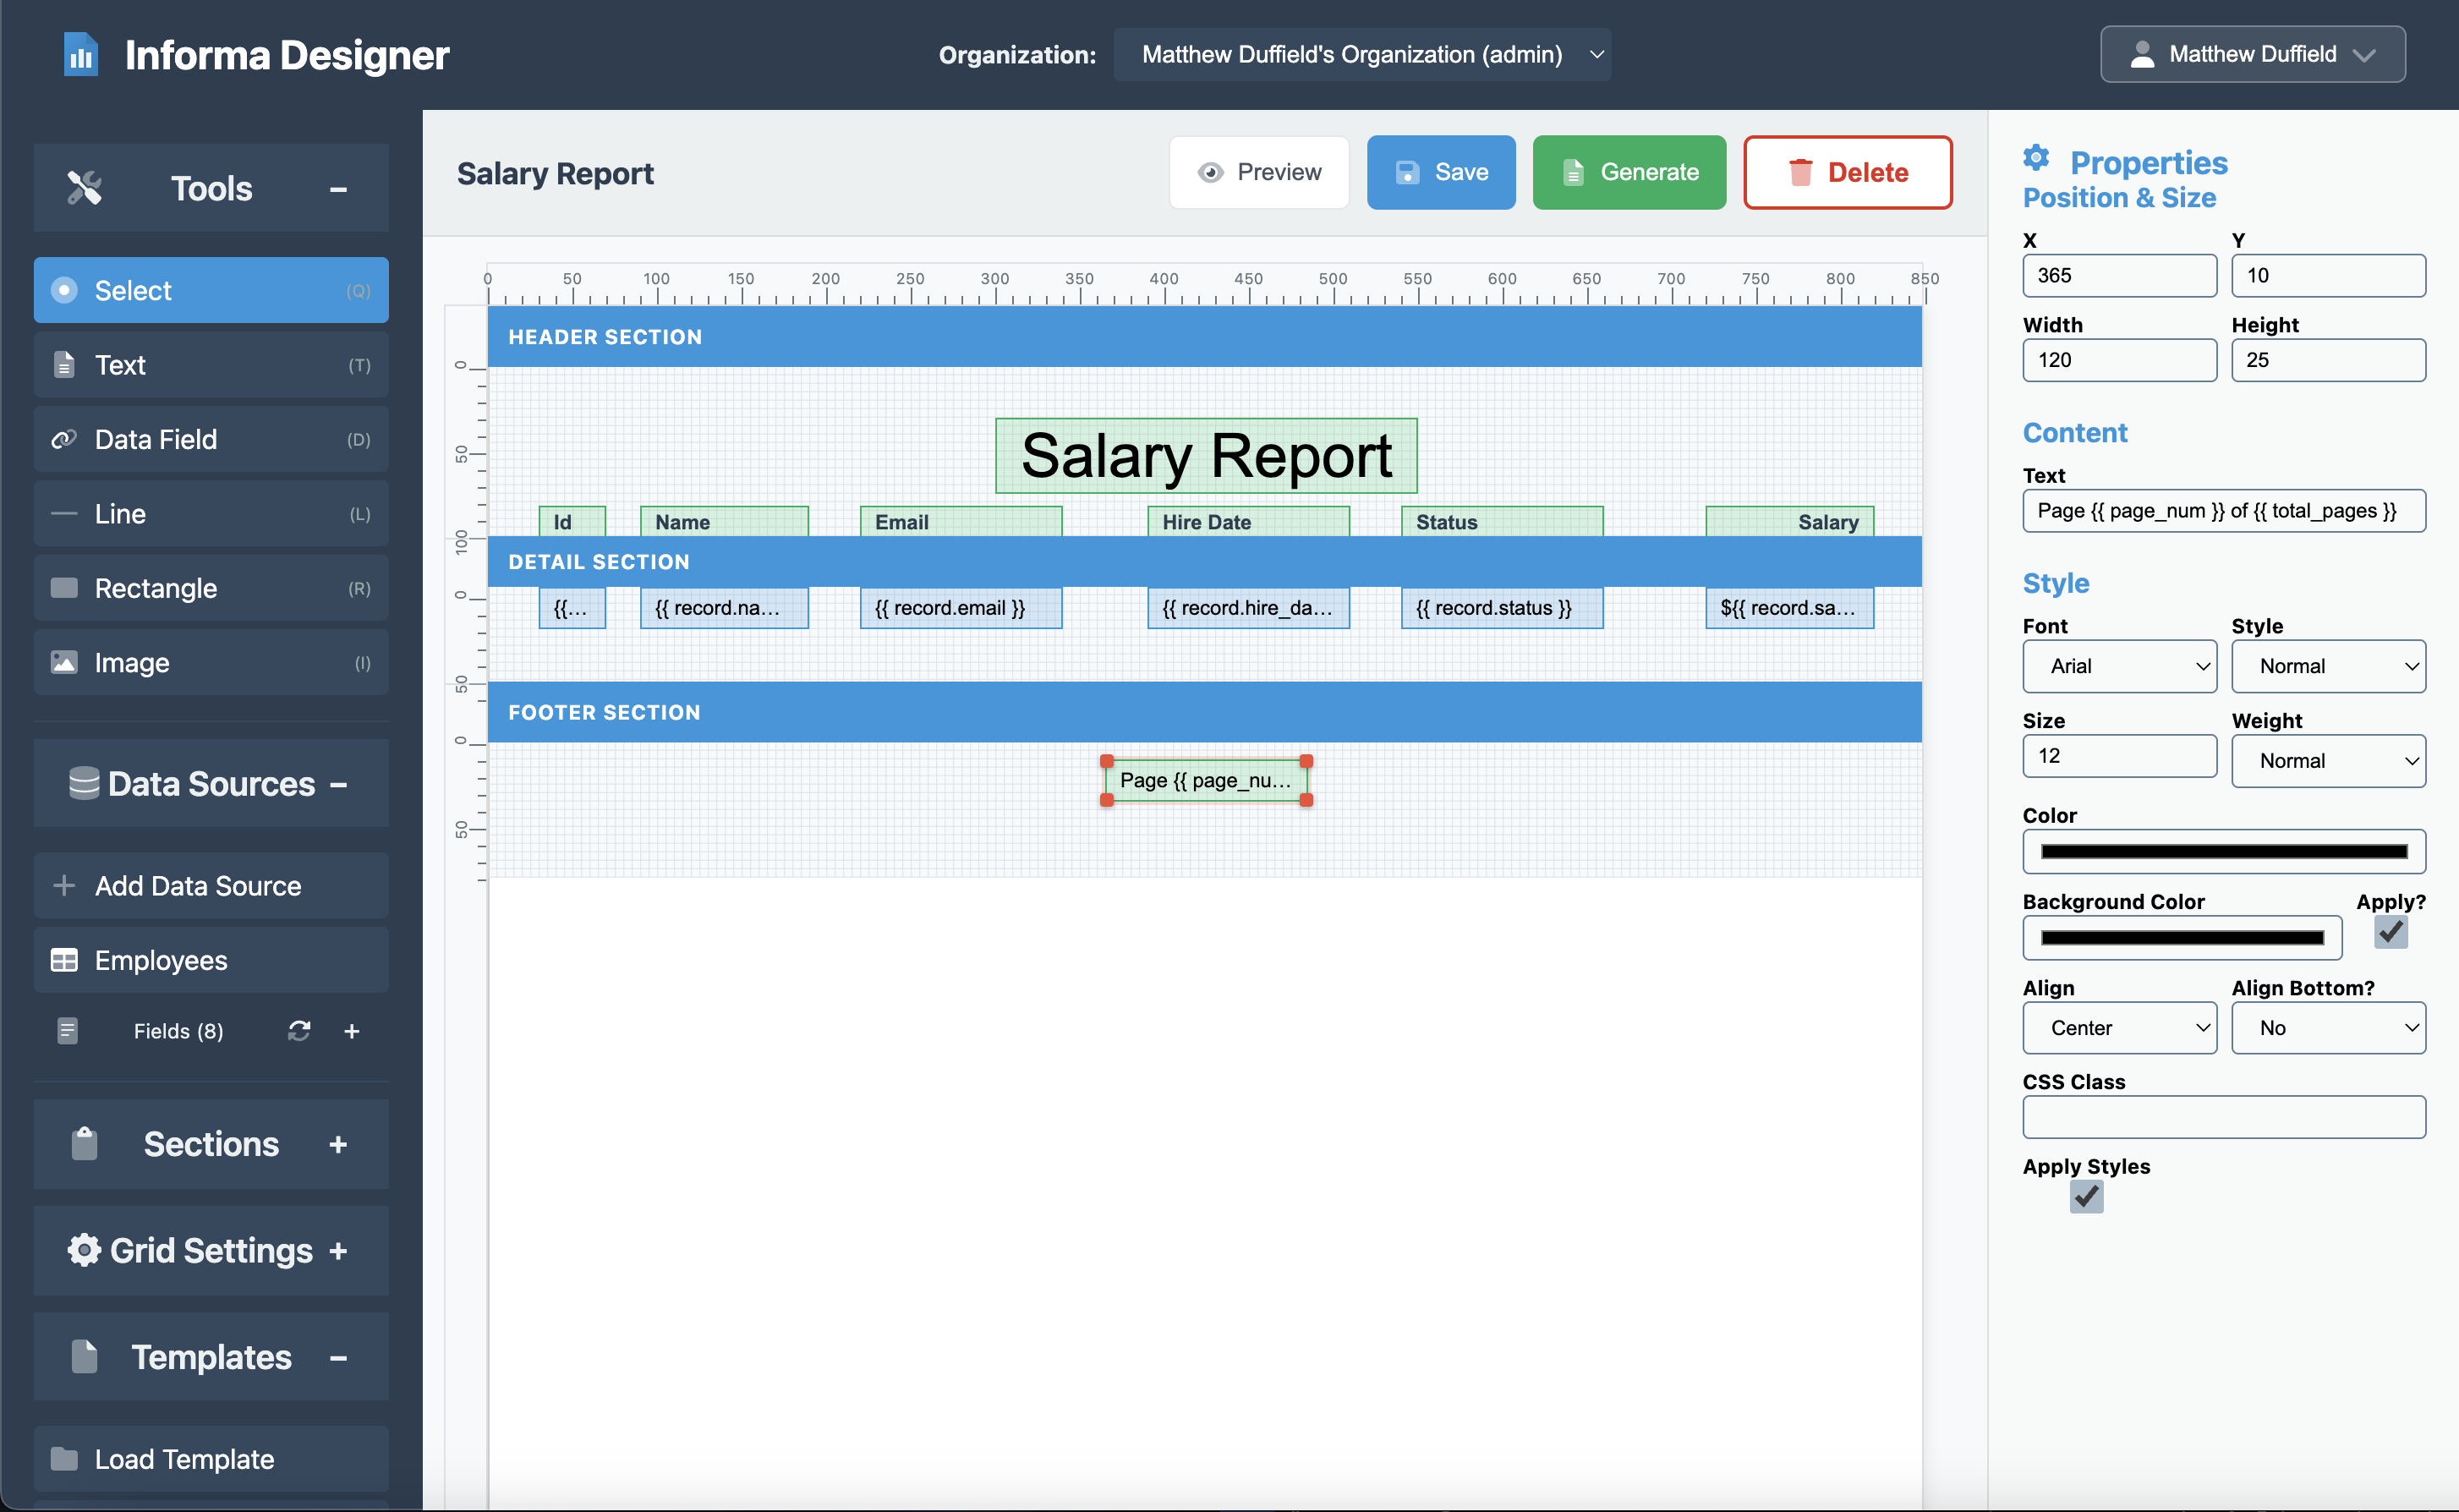
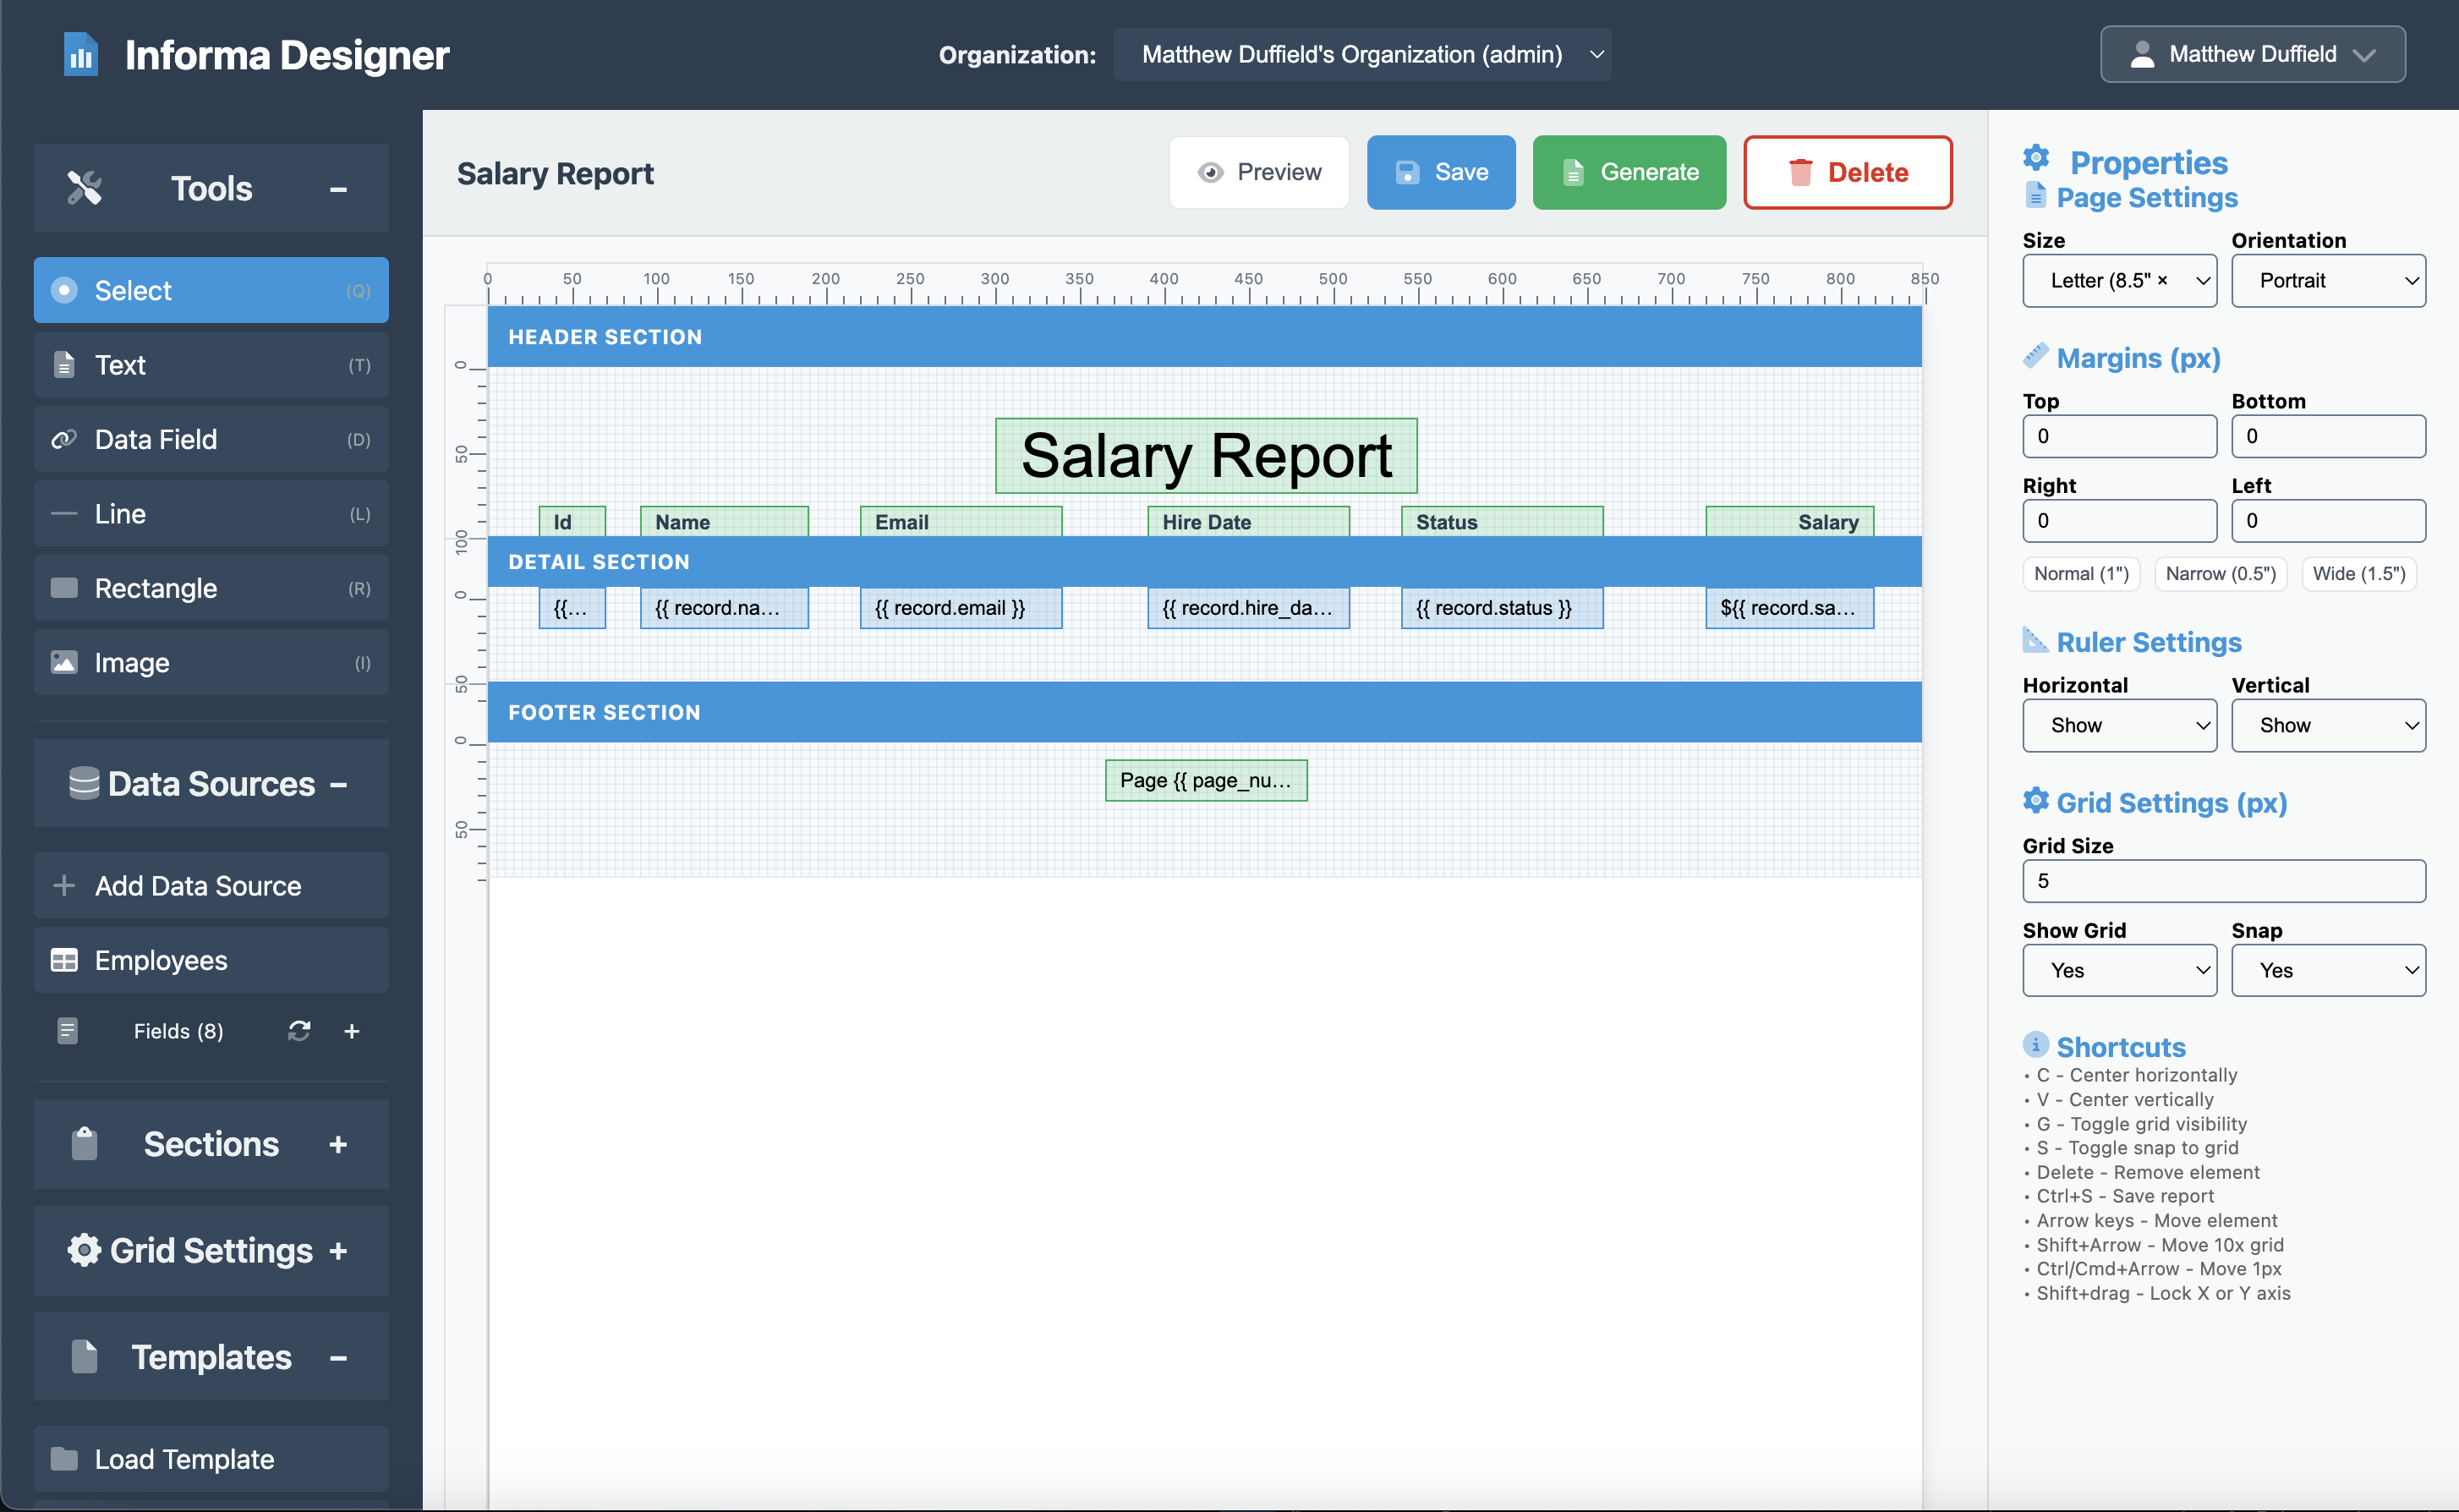
Footer Content
- Click on the Footer section
- Drag a Text element from the toolbar
- Set the properties:
- Content: Page {{ pagenum }} of {{ totalpages }}
- X: 365
- Y: 10
- Width: 120
- Height: 25
- Align: Center
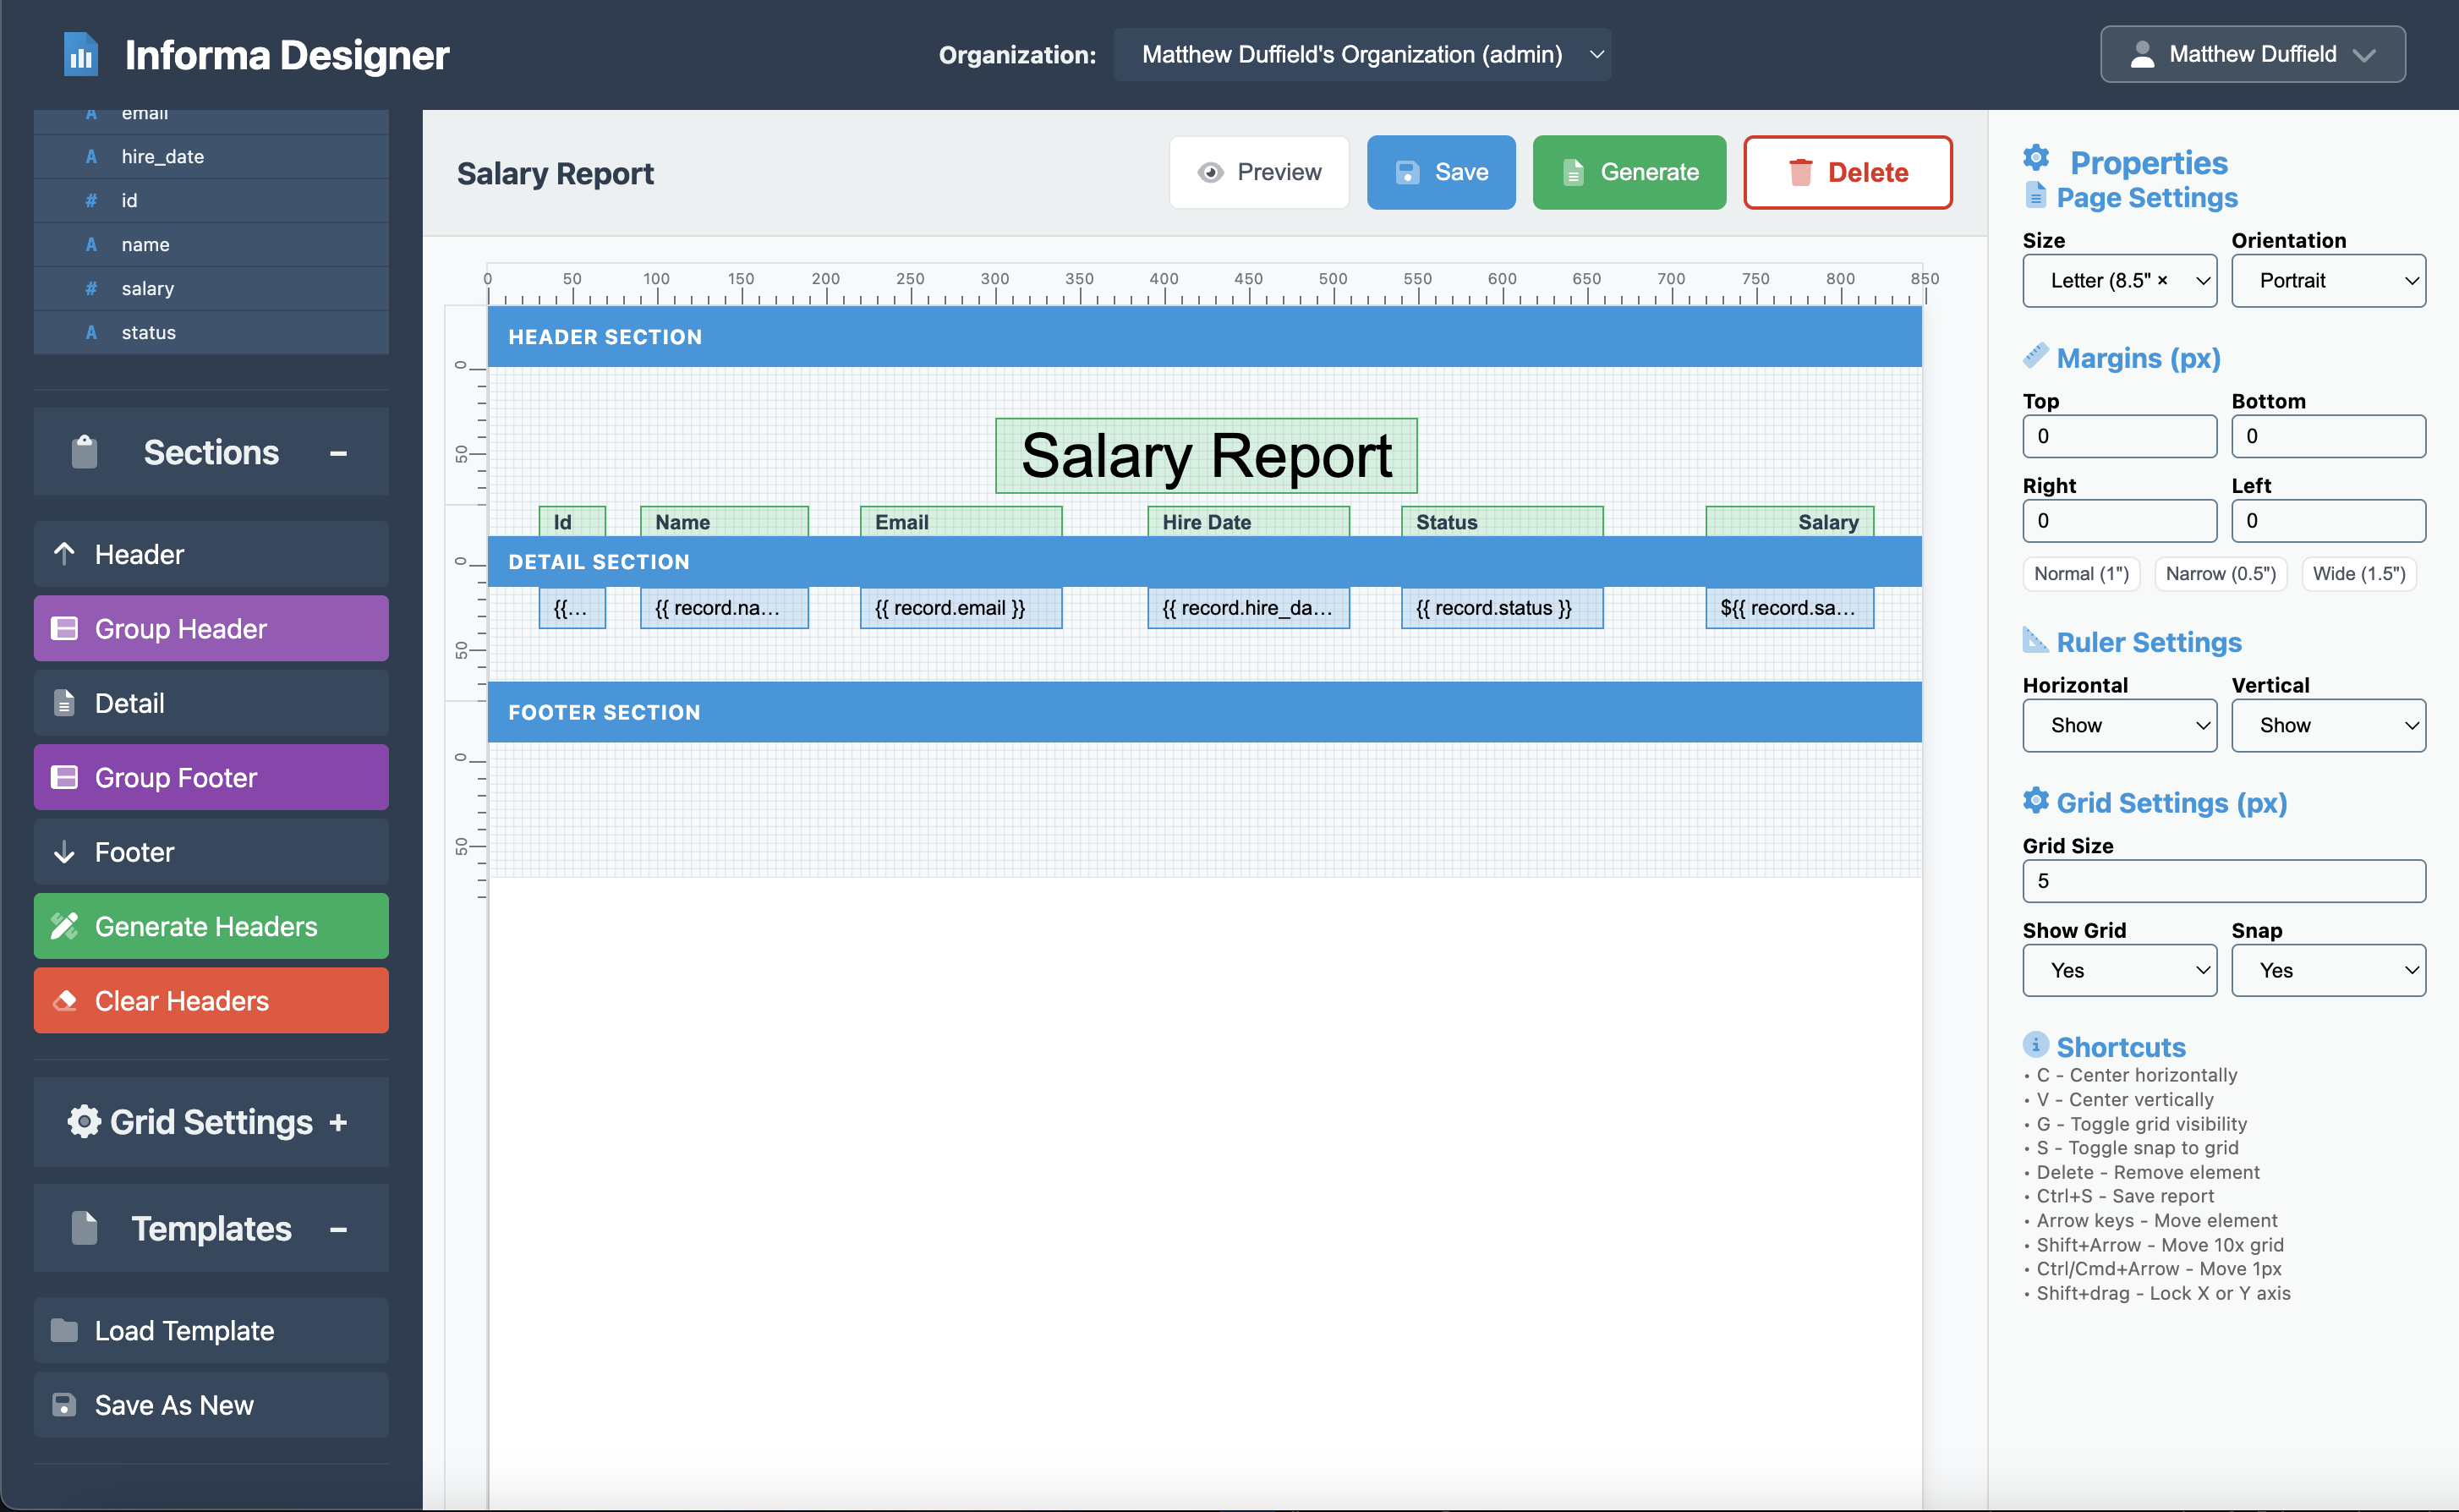
Step 7: Fine-tuning the Layout
Page Settings
Configure your page settings for professional printing:
- Click anywhere on the canvas to go to the Page Settings
- Set the properties:
- Page Size: Letter (8.5” x 11”)
- Orientation: Portrait
- Width: 850 pixels
- Height: 1100 pixels
- Margins (px):
- Top: 0
- Bottom: 0
- Right: 0
- Left: 0
- Ruler Settings
- Horizontal: Show
- Vertical: Show
- Grid Settings (px)
- Grid Size: 5
- Show Grid: Yes
- Snap: Yes
NOTE: The Ruler and Grid settings help ensure that authoring a report is easy to do. It helps ensure all elements align perfectly.
Step 8: Testing Your Report
Before finalizing, it’s crucial to test with actual data:
- Click the Preview button in the toolbar
- The report will render with your live data
- Check that:
- All fields display correctly
- Currency formatting works properly
- Text doesn’t overflow its boundaries
- Page breaks occur at appropriate points
Advanced Customizations
Adding Conditional Formatting
You might want to highlight certain records, such as high salaries or inactive employees. While this basic template doesn’t include conditional formatting, you can:
- Add custom CSS in the report settings
- Use data field properties to apply conditional styles
- Create grouped sections for department subtotals
Sorting and Filtering
To control which records appear and in what order:
- Modify the data source query to filter records
- Add sorting parameters to order by name, salary, or hire date
- Use MongoDB aggregation for more complex filtering
Adding Calculations
For summary information like total payroll:
- Add a summary section
- Use aggregation functions in your data elements
- Display averages, totals, or counts
Best Practices
- Save: Save often to avoid losing any data
- Consistency: Keep fonts, colors, and spacing consistent throughout
- Readability: Use adequate spacing between rows (we used 50px)
- Professional Appearance: Stick to standard fonts like Arial or Helvetica
- Data Privacy: Ensure only authorized users can access salary reports
- Testing: Always preview with real data before sharing
Exporting and Sharing
Once your report is complete, you can:
- Generate HTML reports on-demand
- Use your browser’s “Print to PDF” feature to create PDFs
- Share templates with team members in your organization
- Save templates for reuse whenever needed
Conclusion
Creating a professional salary report in Informa Designer is straightforward once you understand the basic components. This template provides a clean, organized view of employee compensation data that’s suitable for HR departments, management reviews, or compliance reporting.
The visual designer makes it easy to adjust layouts without coding, while the template system ensures consistency across all your reports. Whether you’re generating reports for 10 employees or 10,000, this format scales beautifully and maintains its professional appearance.
Next Steps
- Try adding grouping by department
- Include year-to-date totals
- Add charts for salary distribution
- Create variations for different audiences (summary vs. detailed)
With Informa Designer’s flexible platform, you can adapt this basic template to meet your organization’s specific needs while maintaining a professional, consistent look across all your reports.