Creating Employee Reports with Department Grouping
Published: June 16, 2025
Reading Time: 8 minutes
Author: The Informa Designer Team
Organizing employee data by department is a common reporting need for HR departments and managers. In this tutorial, we’ll create a professional employee report that automatically groups employees by their department, making it easy to see team structures and departmental information at a glance.
What We’ll Build
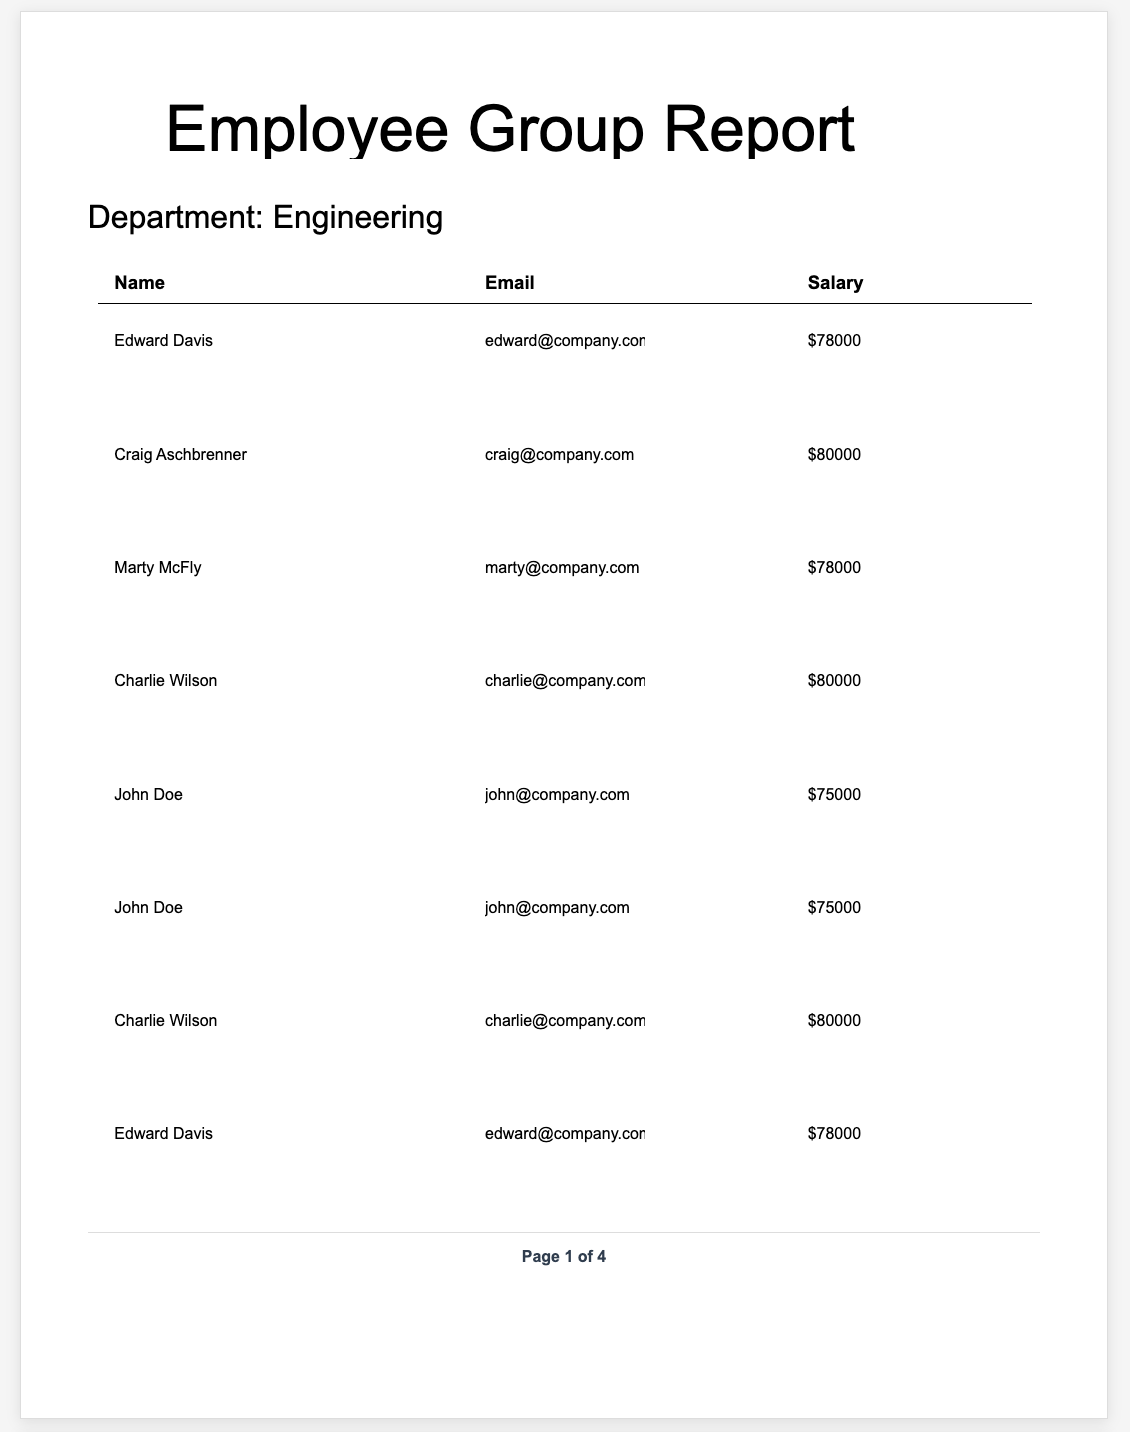
By the end of this tutorial, you’ll have created an employee report that: - Groups employees by department automatically - Shows department headers with clear visual separation - Lists employee details (name, email, salary) in an organized table - Includes page numbering for multi-page reports - Looks professional and print-ready
Prerequisites
- An Informa Designer account (free tier is perfect)
- A MongoDB database with employee data
- Basic familiarity with the Informa Designer interface
Step 1: Create a New Report Template
Let’s start by creating a new report in your dashboard.
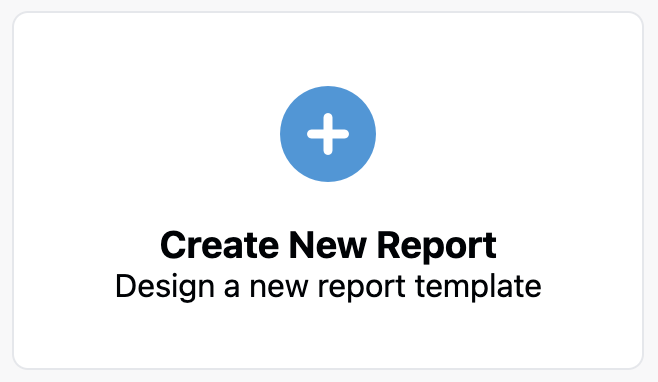
- Click “Create New Report” in your dashboard
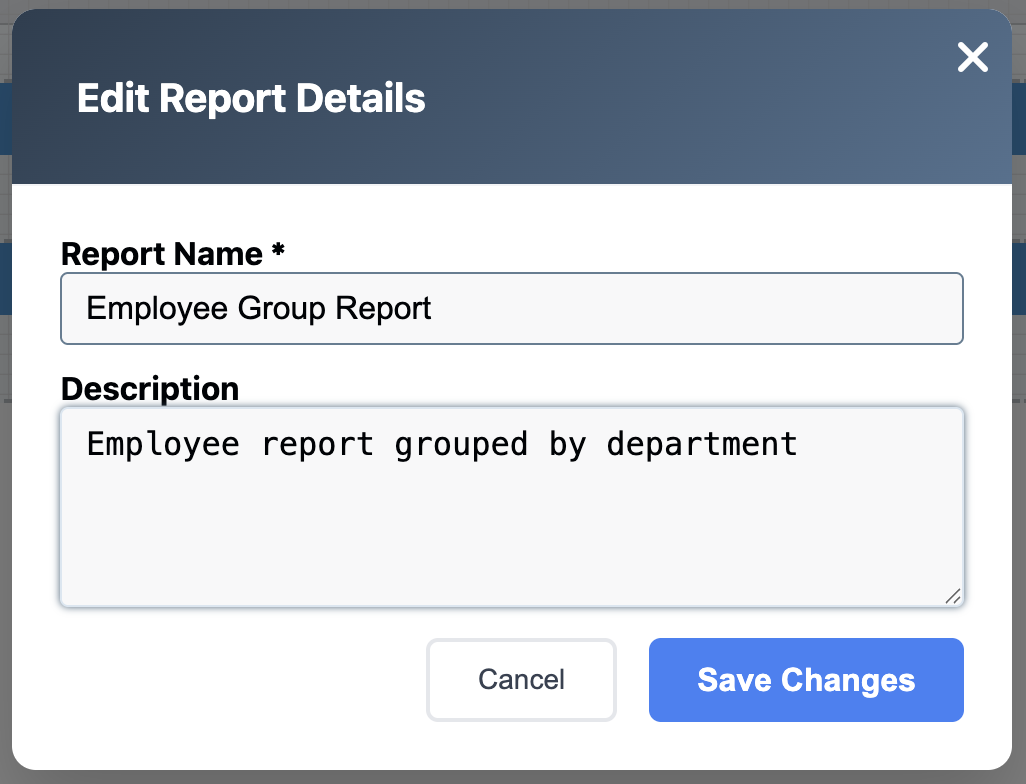
- In the designer, click on the “New Report” link
- Name it: “Employee Group Report”
- Description: “Employee report grouped by department”
- Click “Save Changes”
Step 2: Connect to Your Employee Data
Before designing, we need to connect to your employee collection.

- In the Data Sources section, click “Add Data Source”
- Configure the connection:
- Name: “Employees”
- Type: MongoDB
- Collection: “employees”
- Query:
{}(fetches all employees)
- Click “Test Connection” to be sure the connection is valid
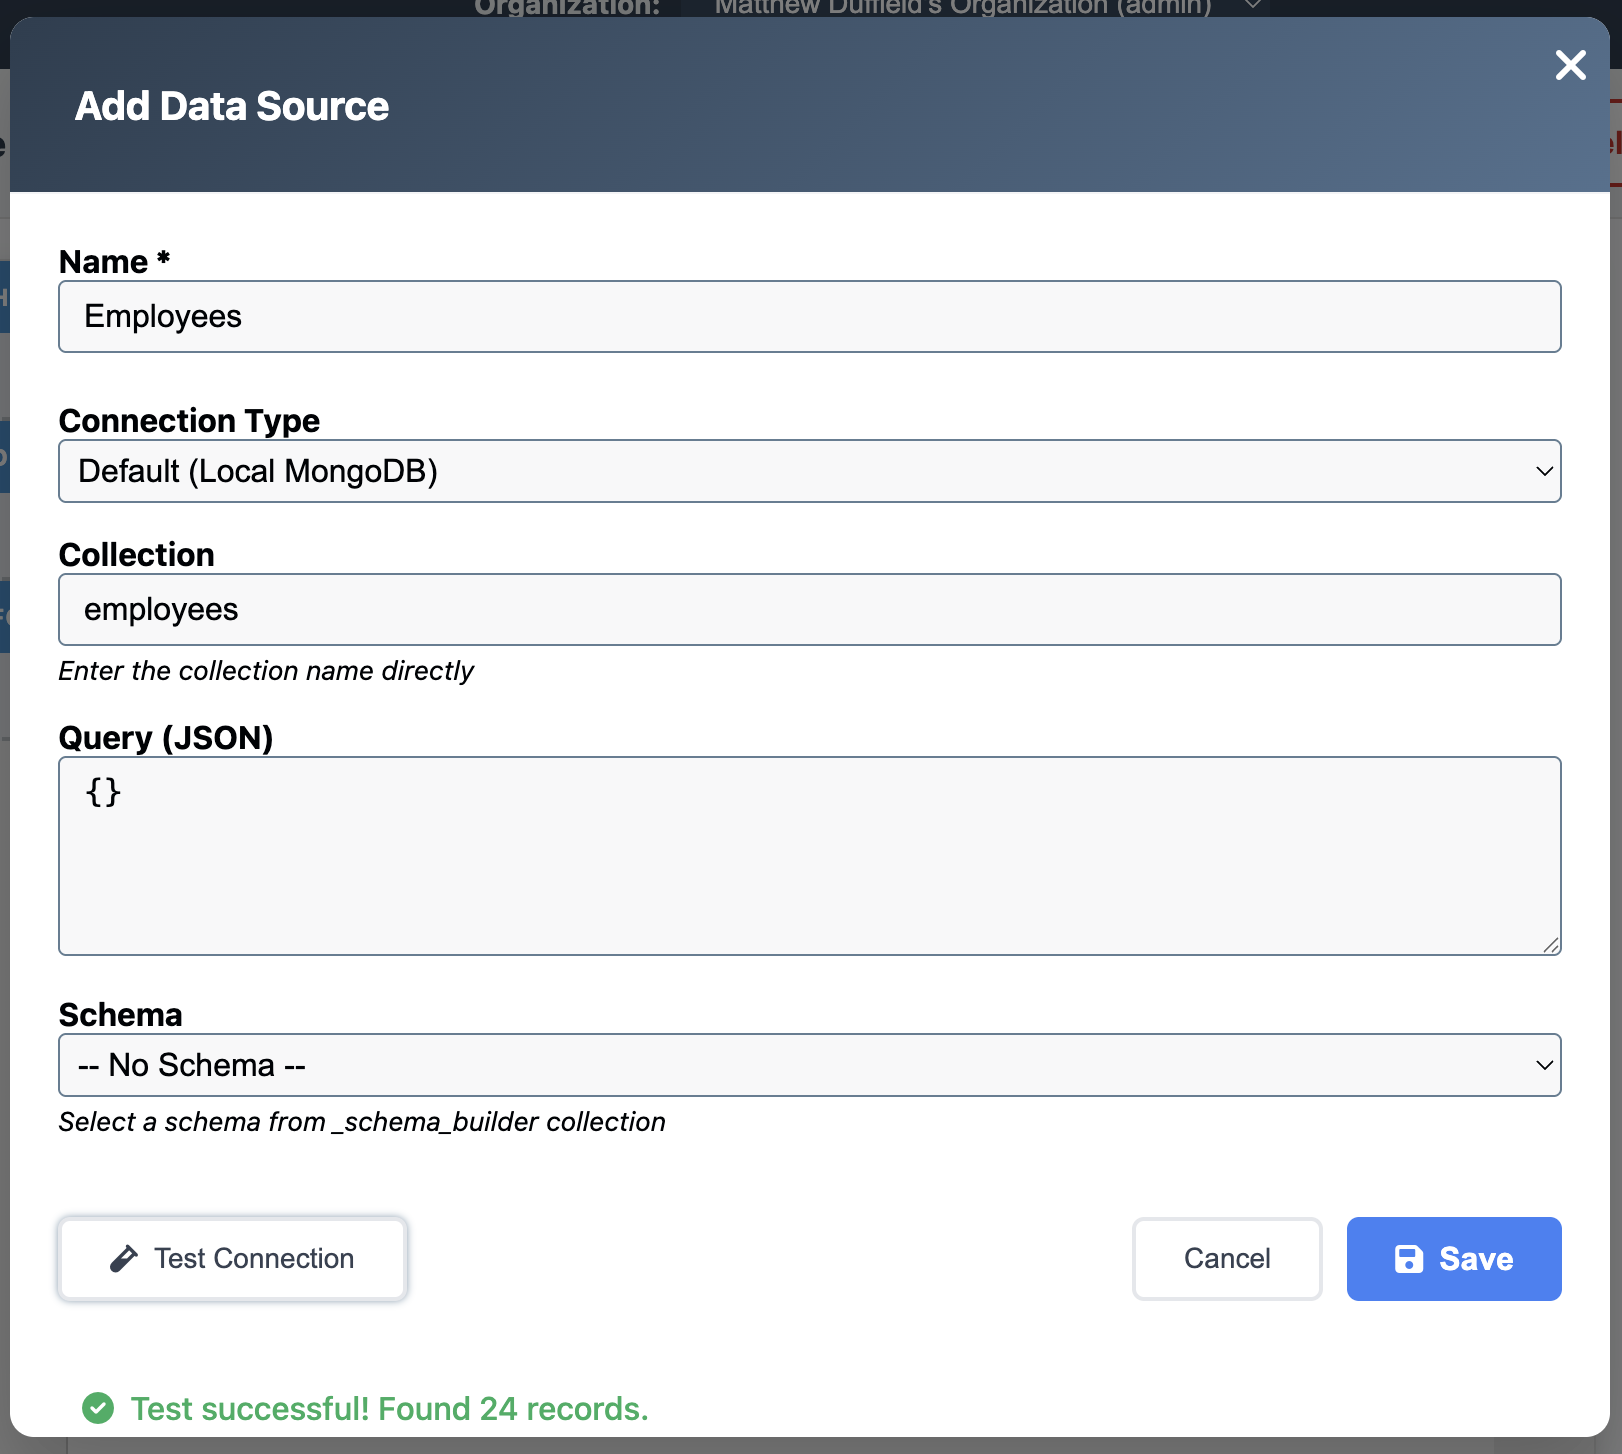
- Click “Save” to add the data source
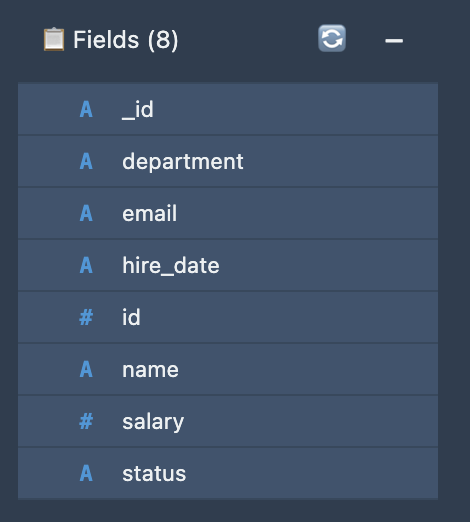
- Click the refresh button (🔄) to discover fields
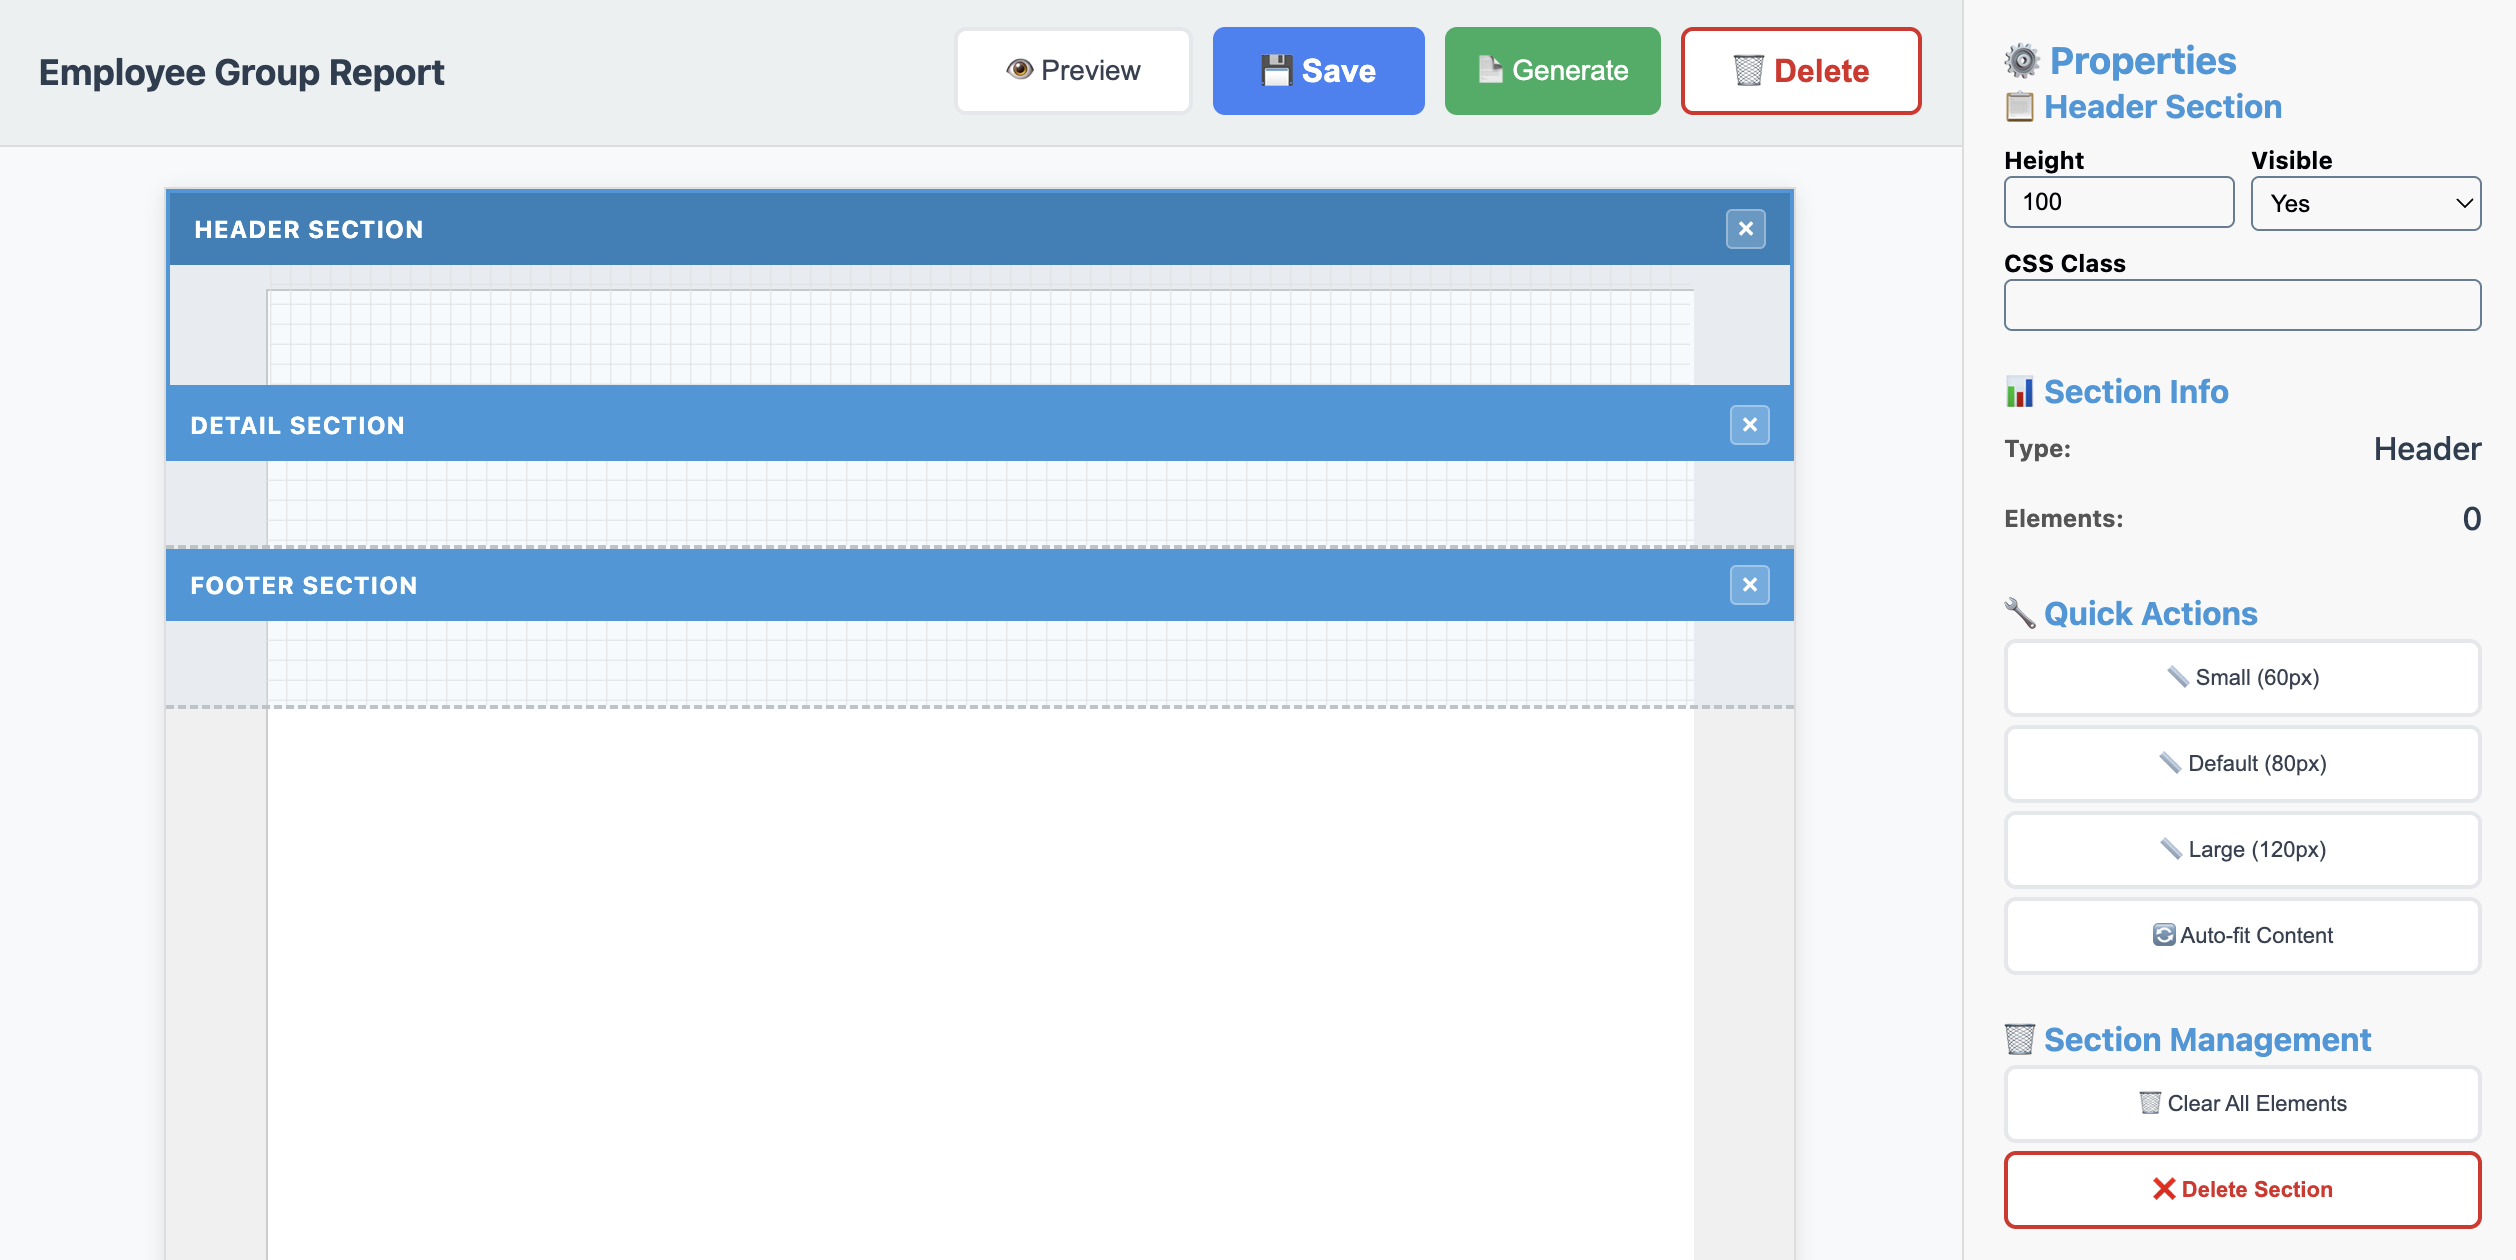
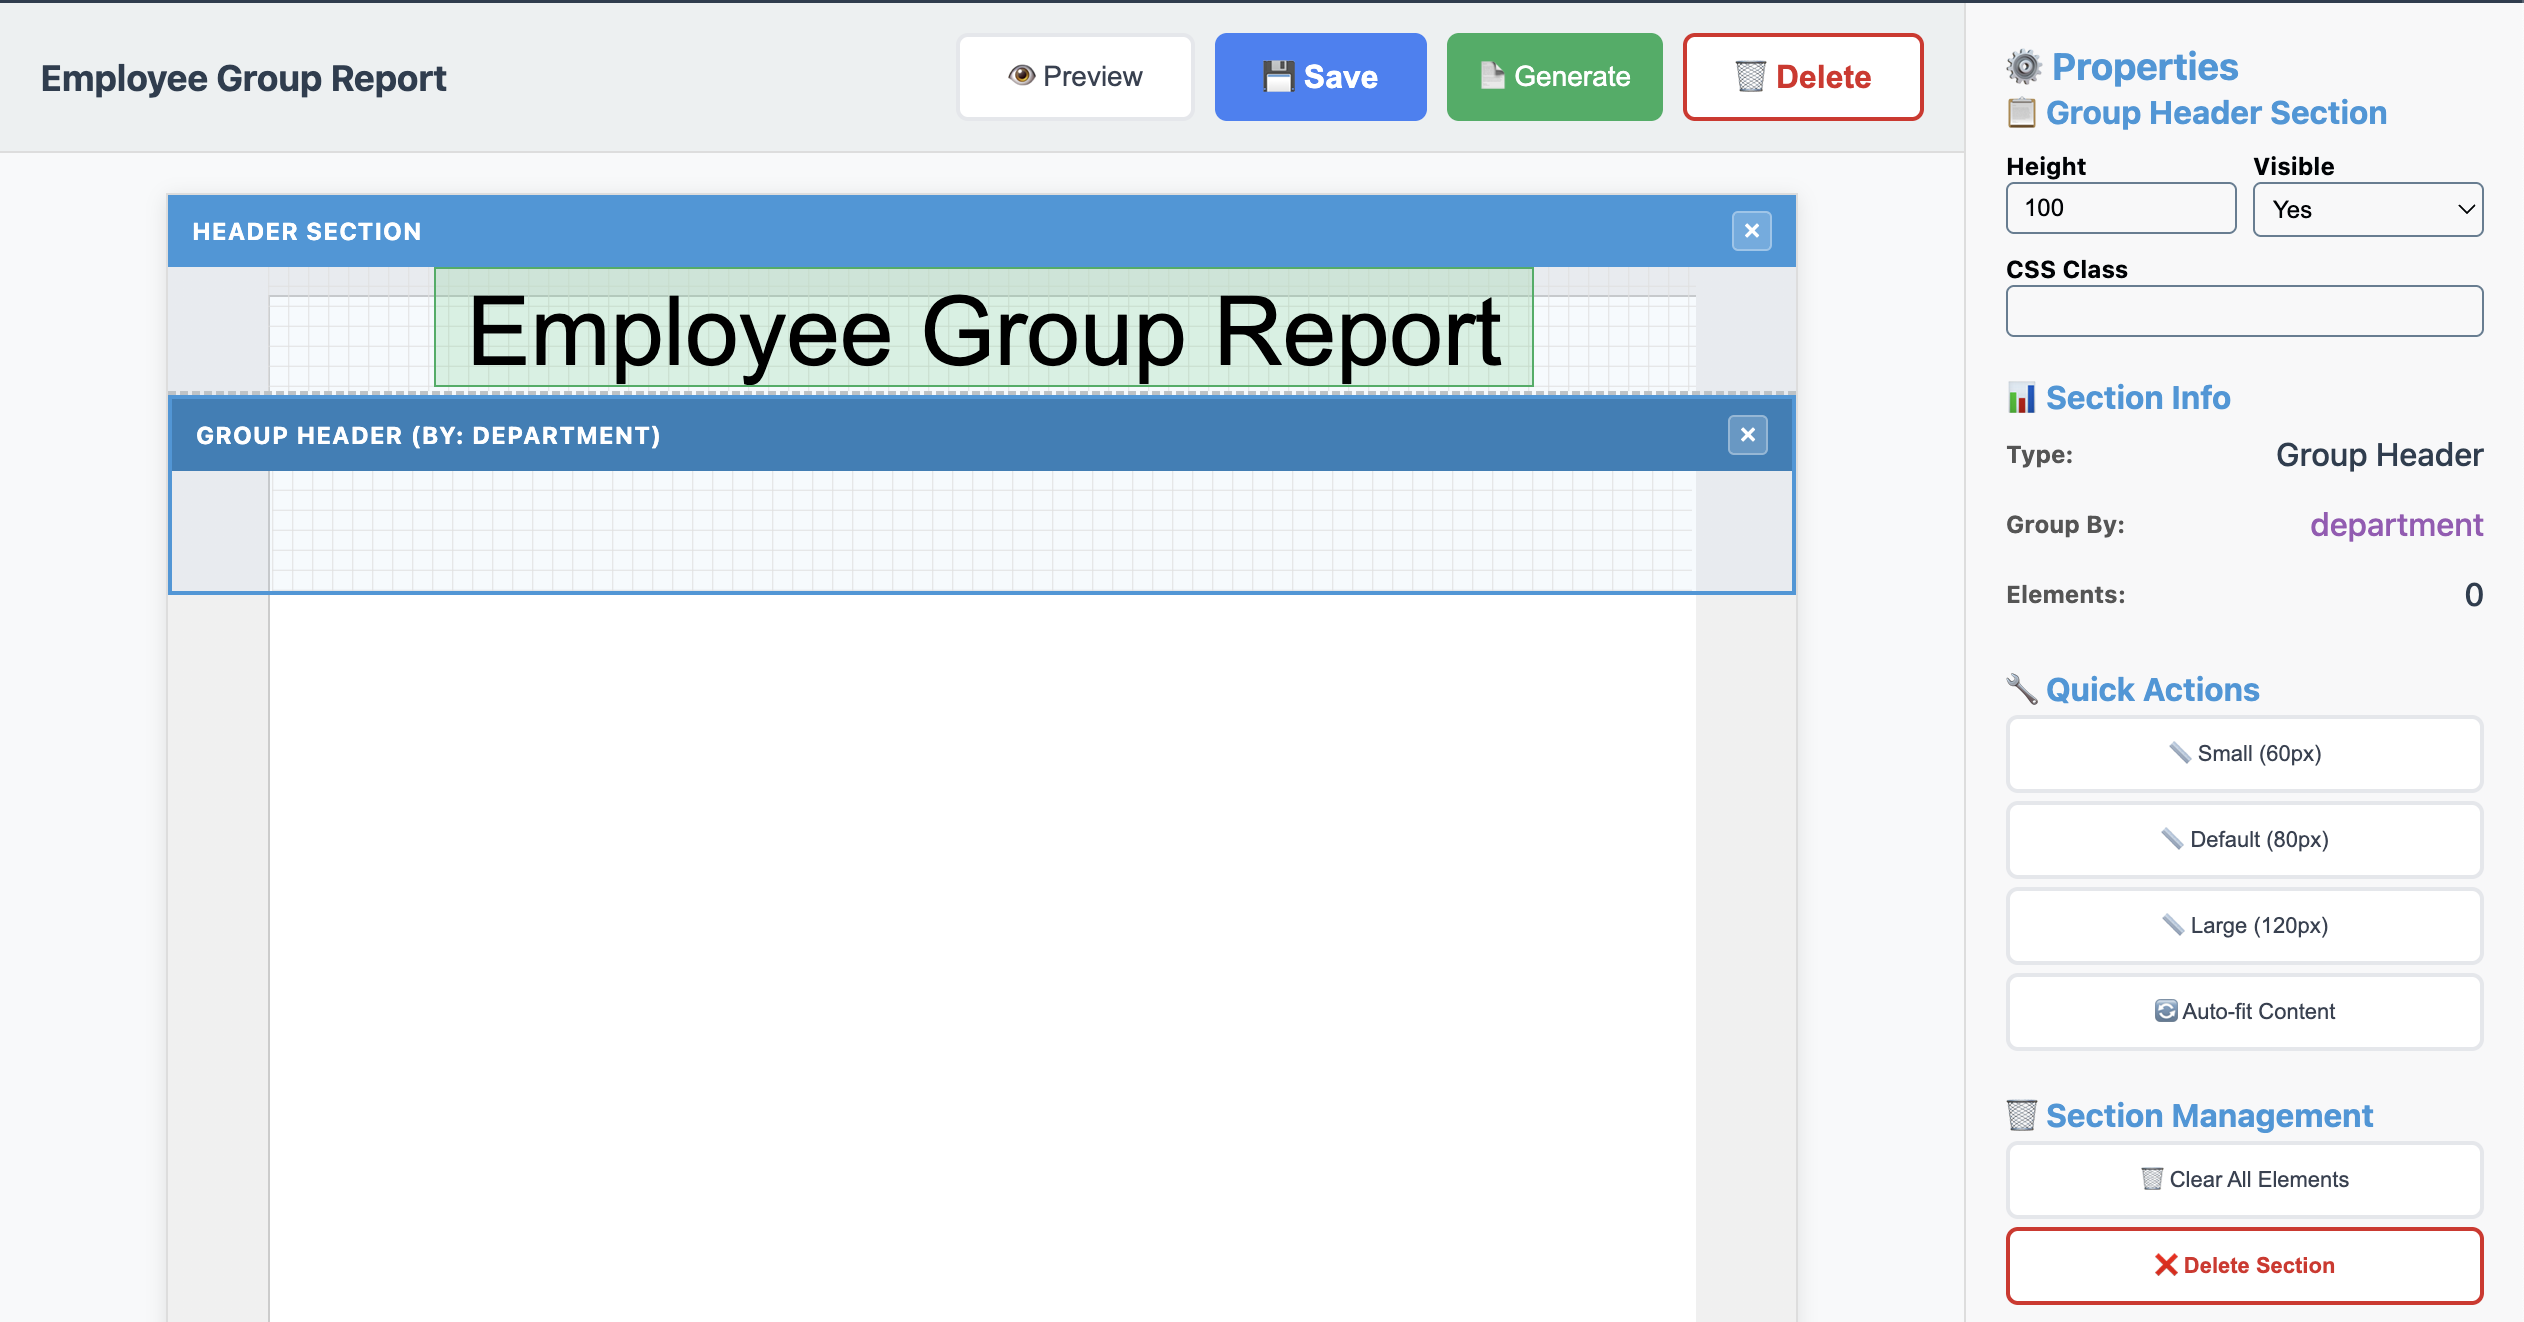
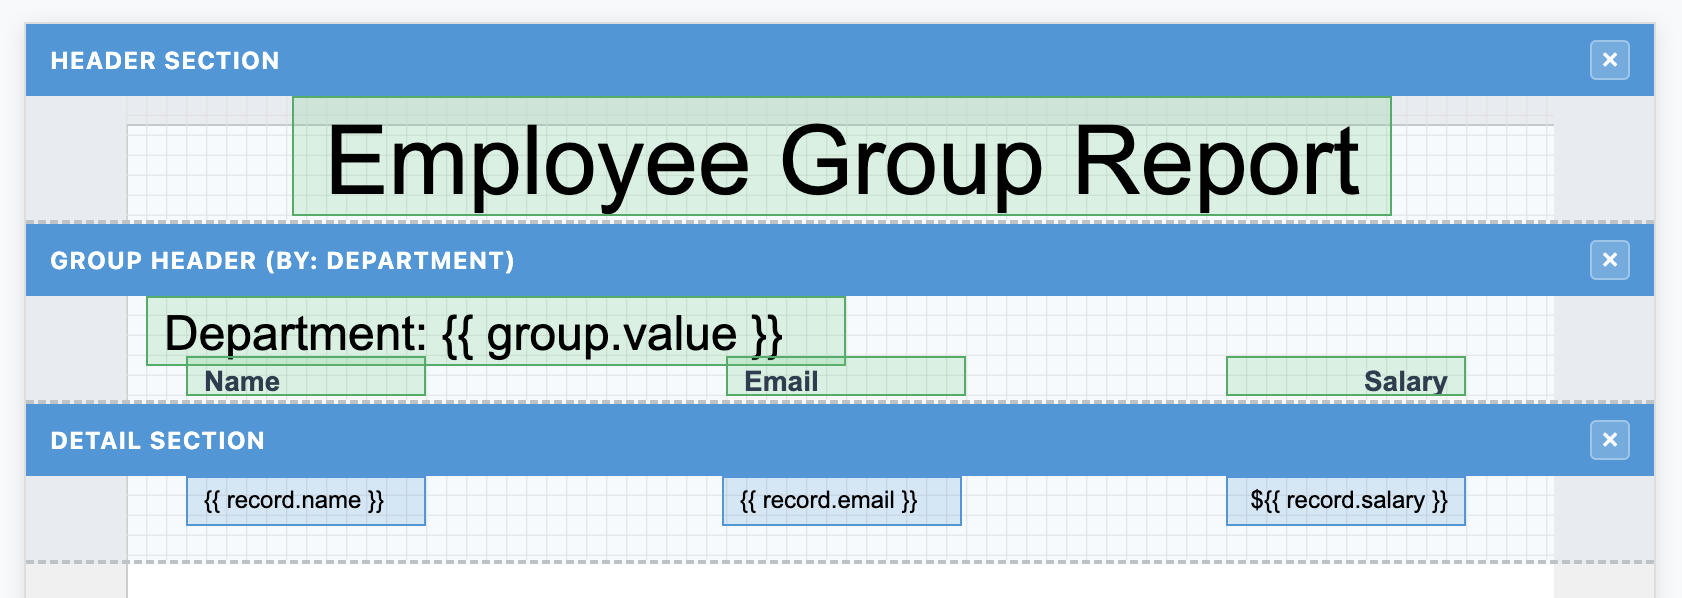
Step 3: Header Section
- Click on the Header Section on the canvas
- Set the properties:
- Height: 100
- Visible: Yes
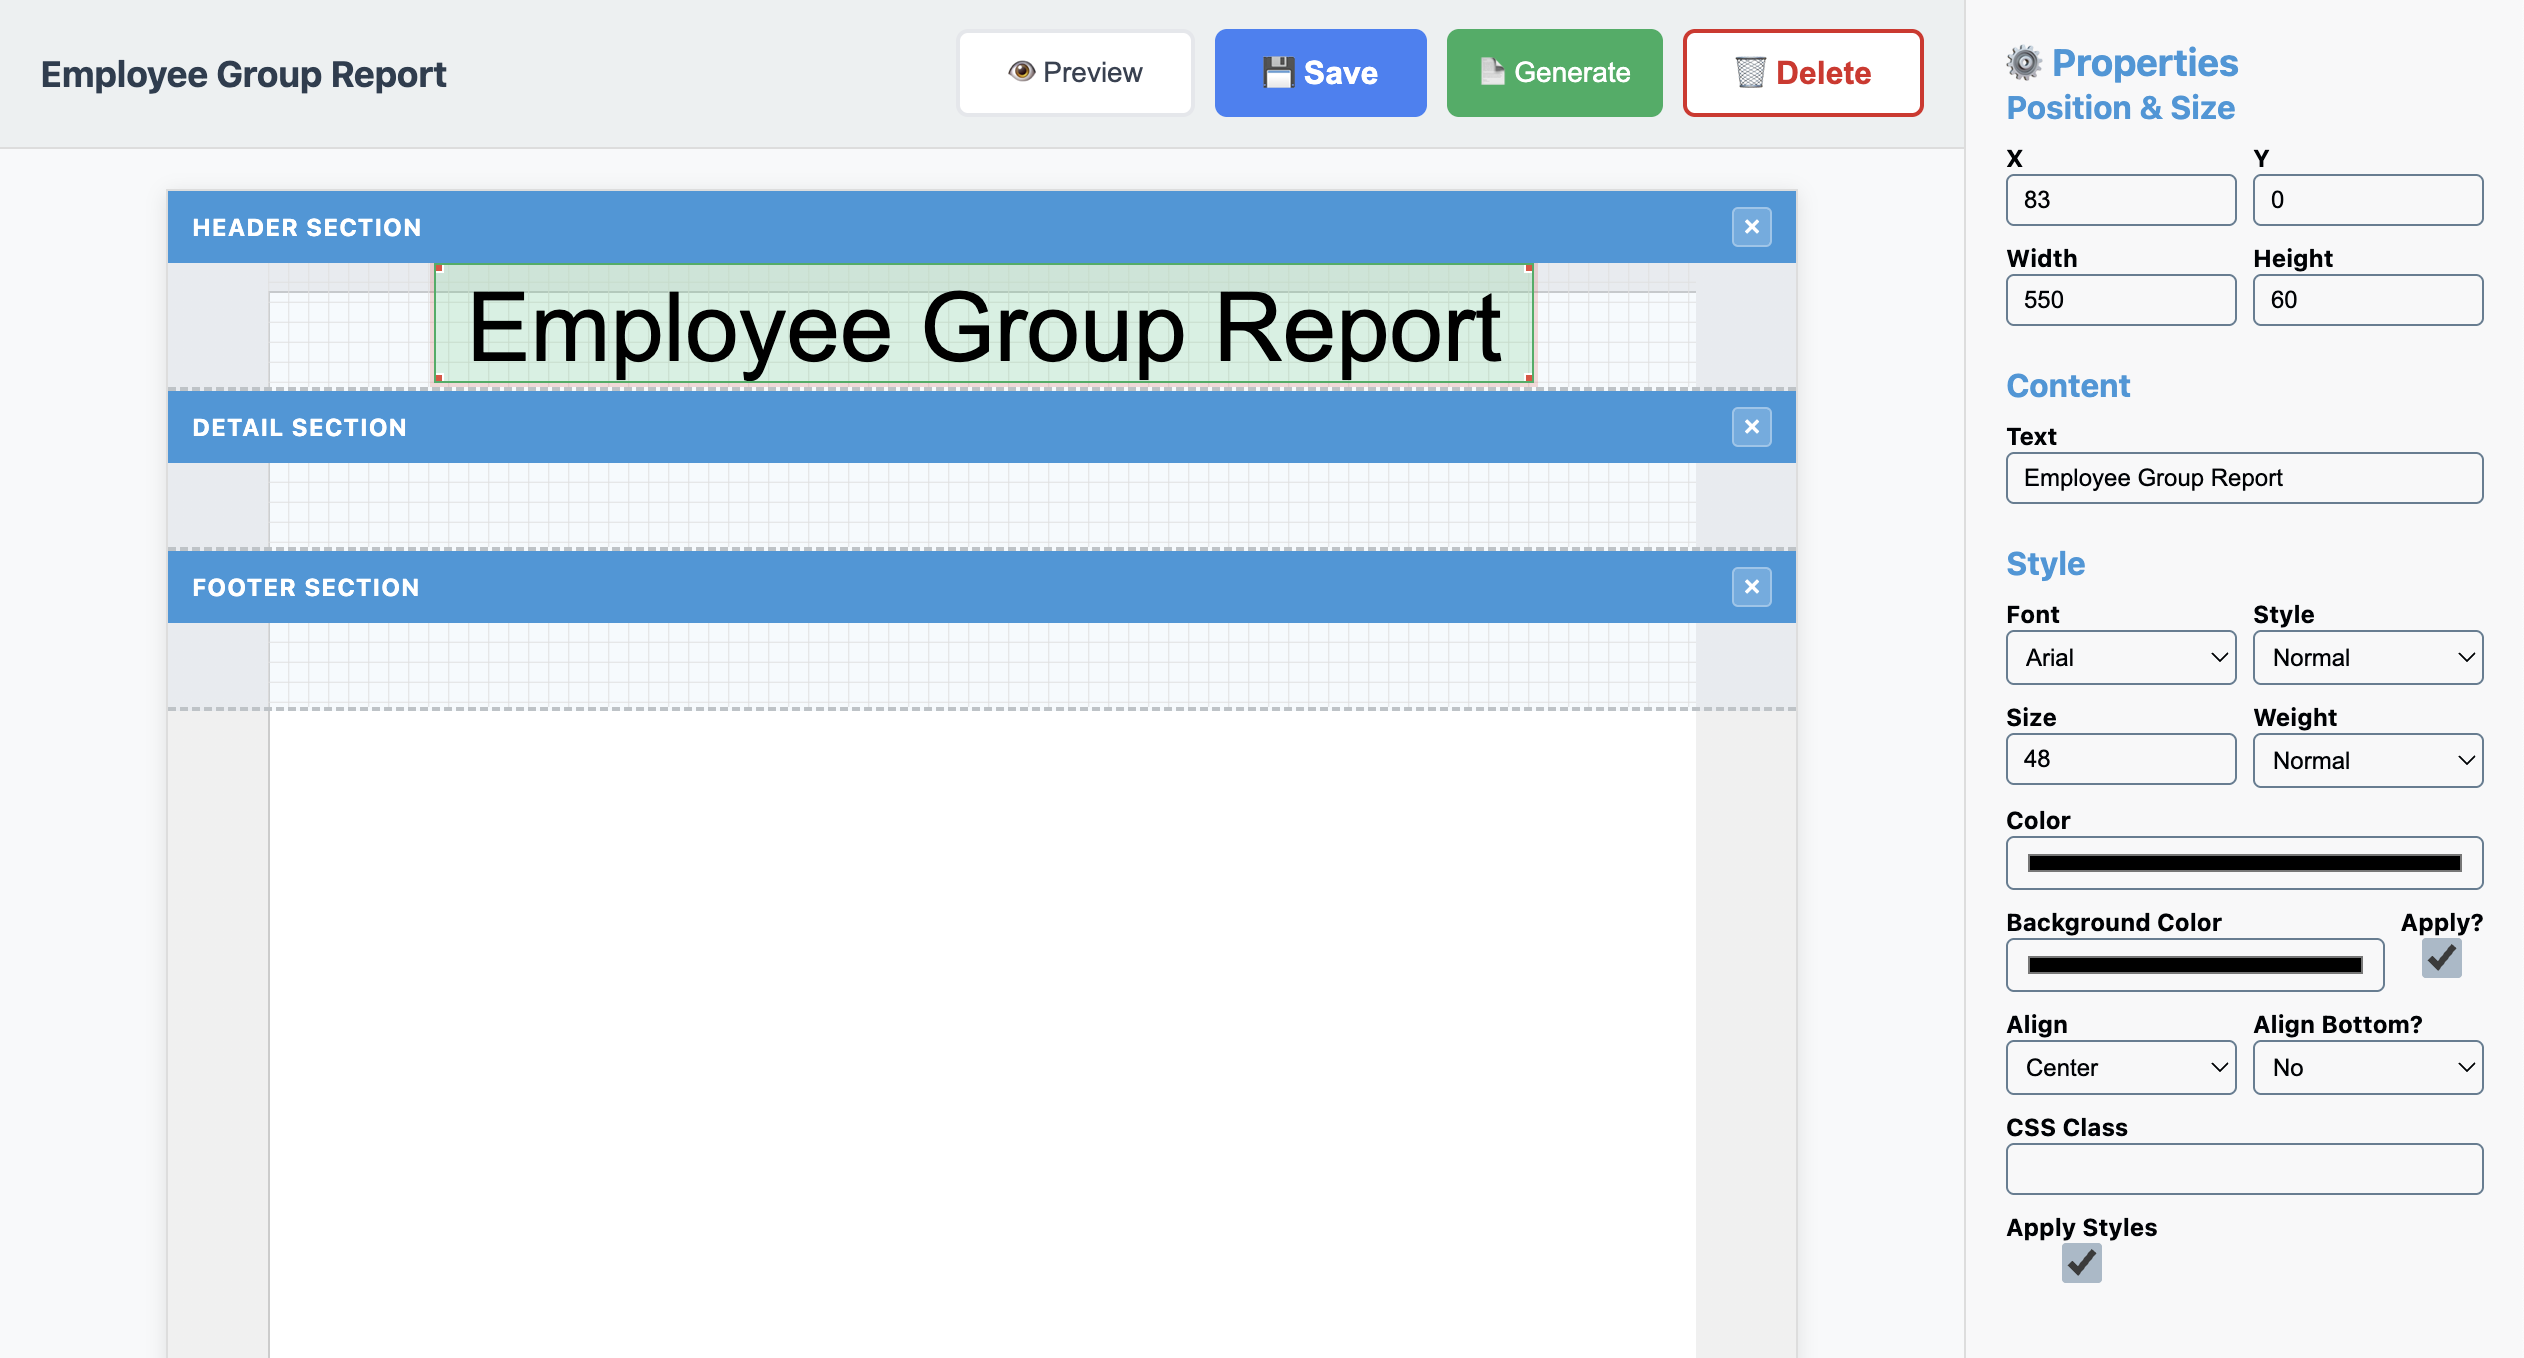
Step 4: Design the Report Header
Let’s create an eye-catching header for our report.

- Select the Text tool (📝) from the Tools panel
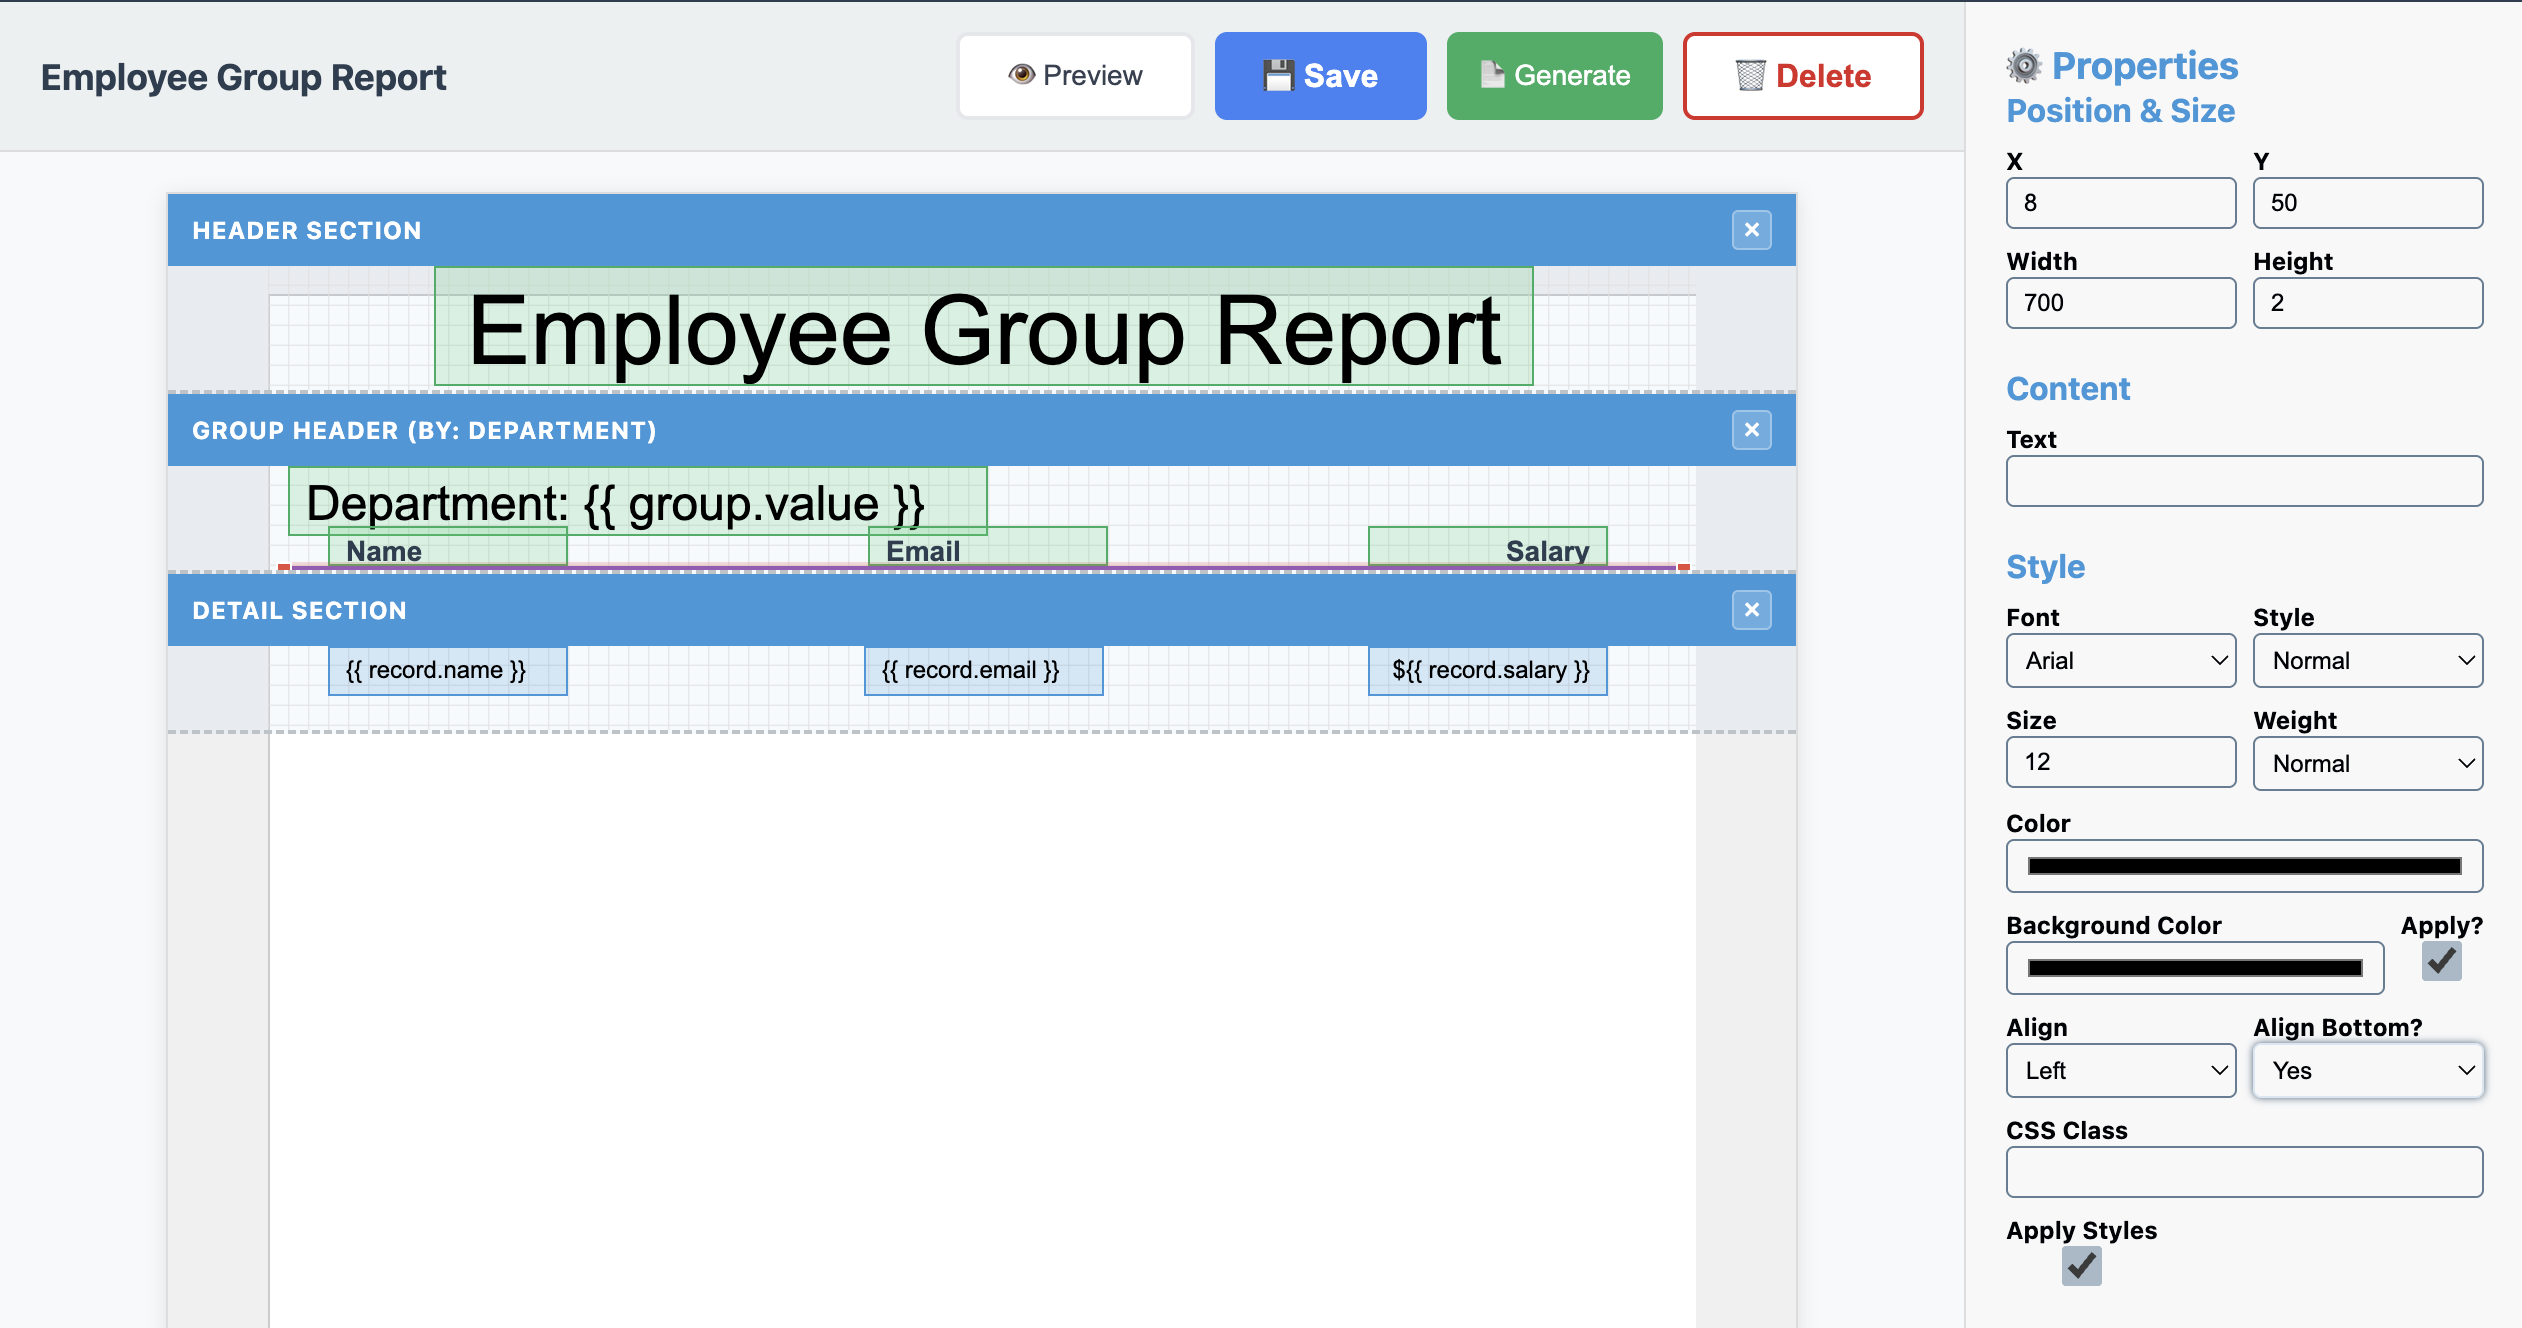
- Draw a text element at the top of the canvas
- Set the properties:
- X: 83
- Y: 0
- Width: 550
- Height: 60
- Text: “Employee Group Report”
- Font Size: 48px
- Font Family: Arial
- Align: Center
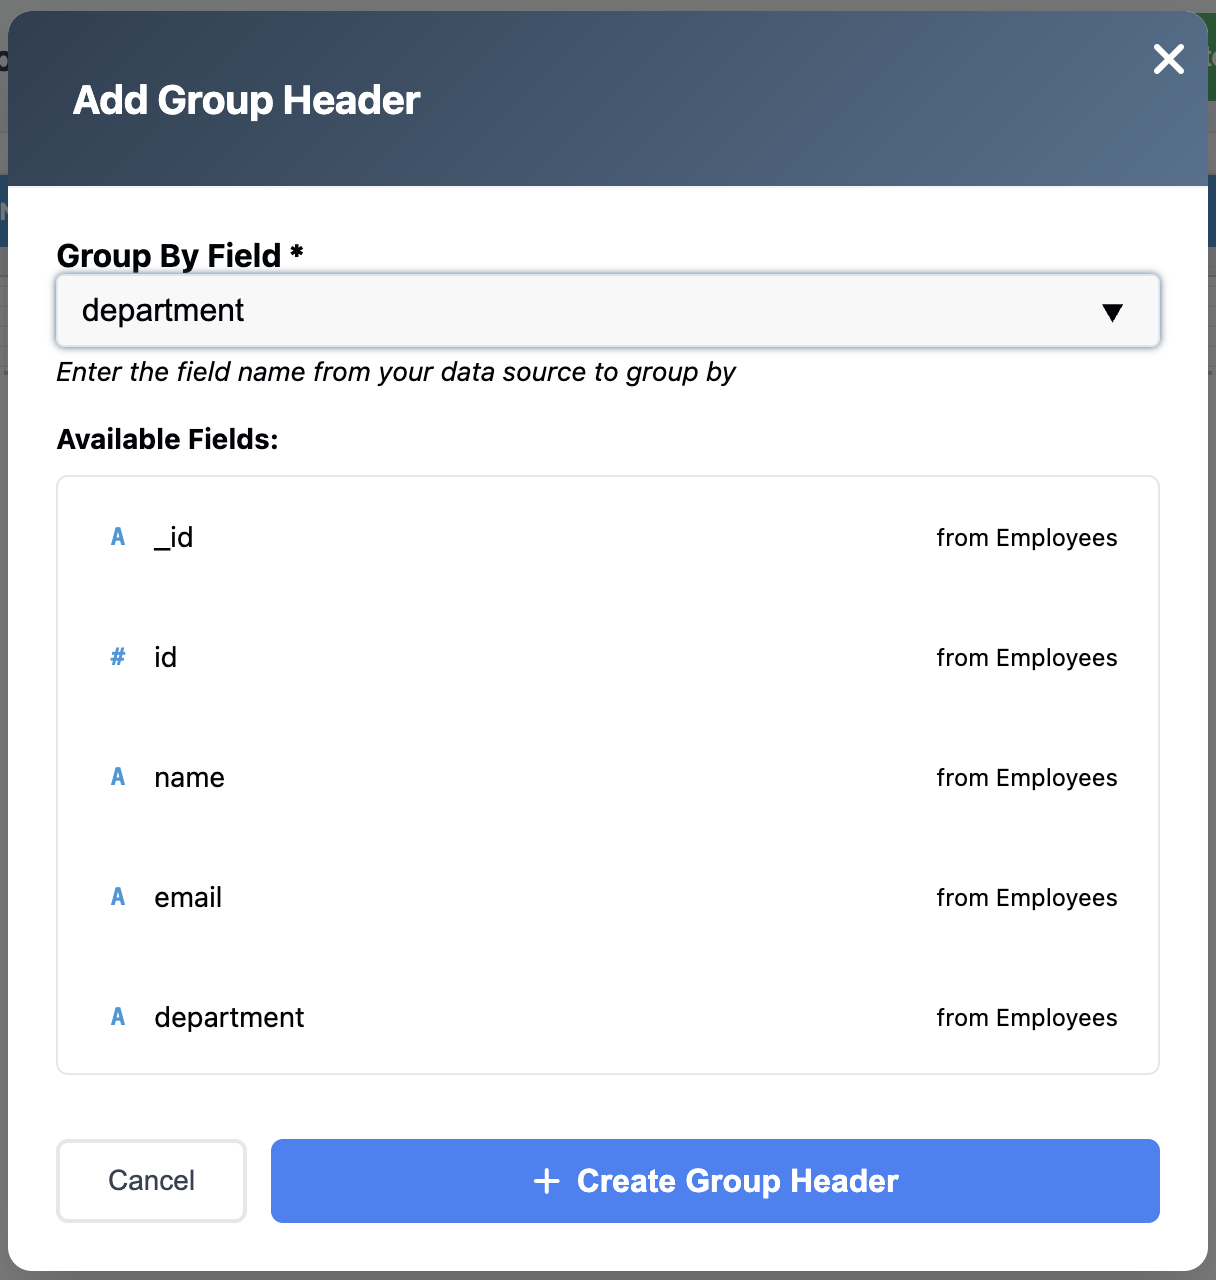
Step 5: Create the Department Group Header
This is the key feature - creating a section that repeats for each department.

- Click “Group Header” in the Sections panel
- In the modal that appears:
- Select “department” as the grouping field
- Click “Create Group Header”
Now let’s design the department header:
Group Header Section
- Click on the Group Header Section on the canvas
- Set the properties:
- Height: 90
- Visible: Yes
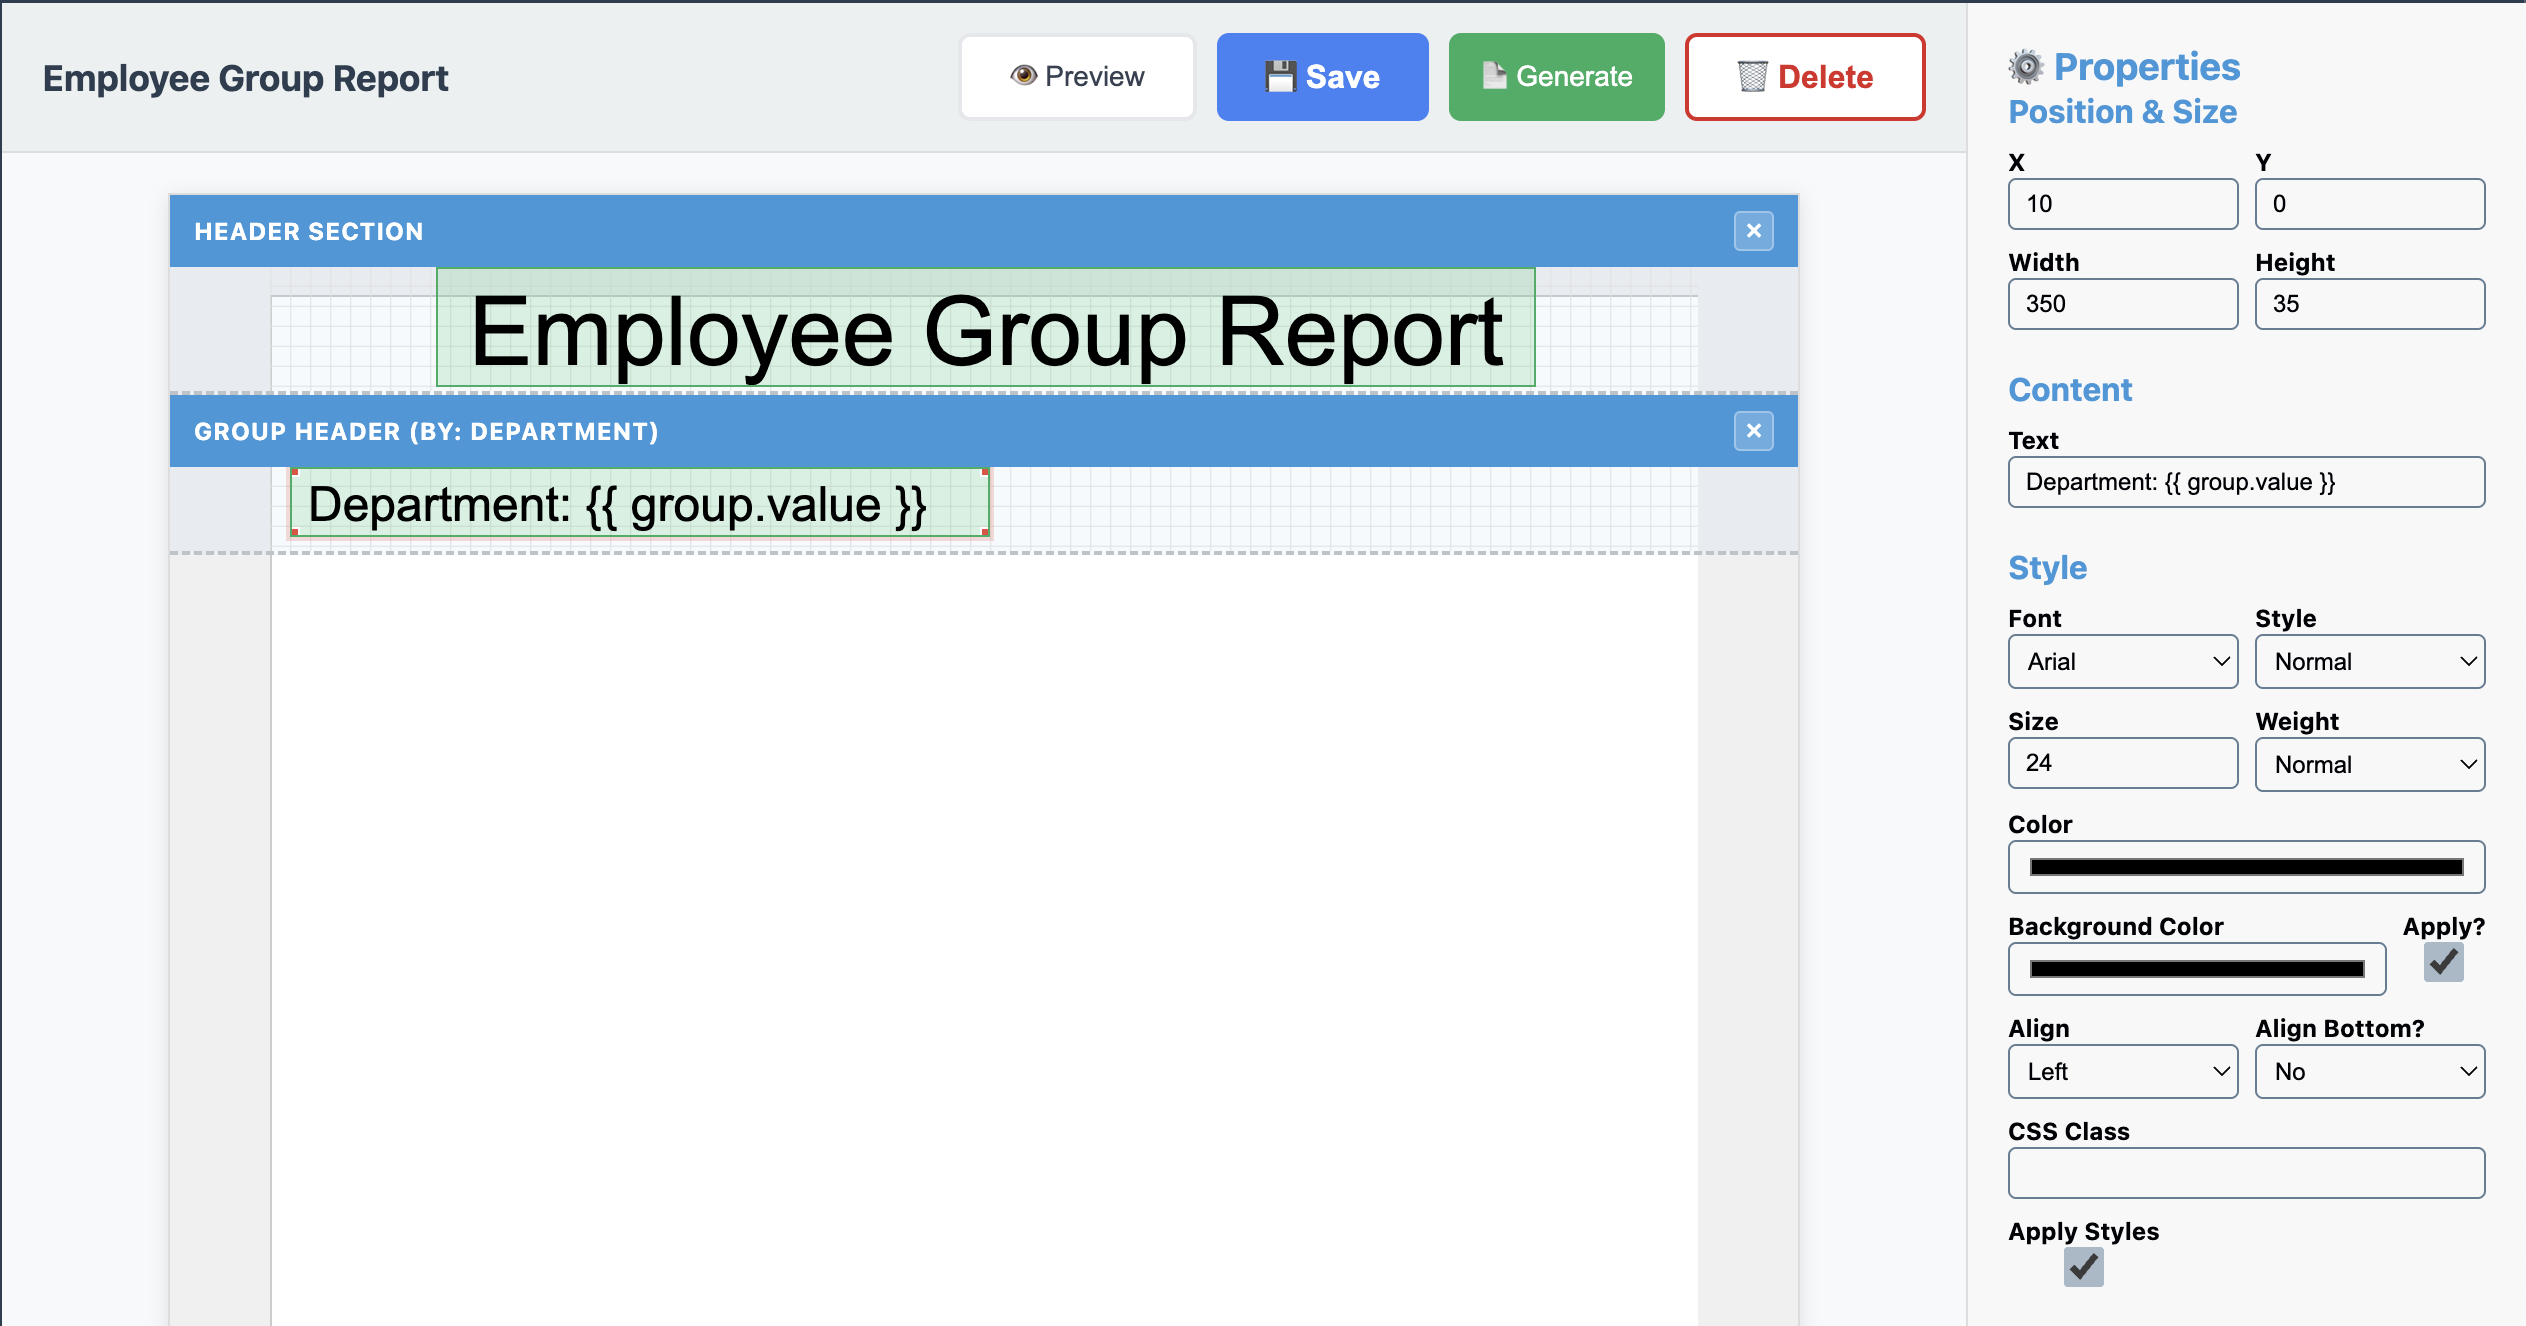
Add Department Name
- Add a Text element to the group header
- Set the Text to:
Department: {{ group.value }} - Set the properties:
- X: 10
- Y: 0
- Width: 350
- Height: 35
- Font Size: 24
- Align: Left
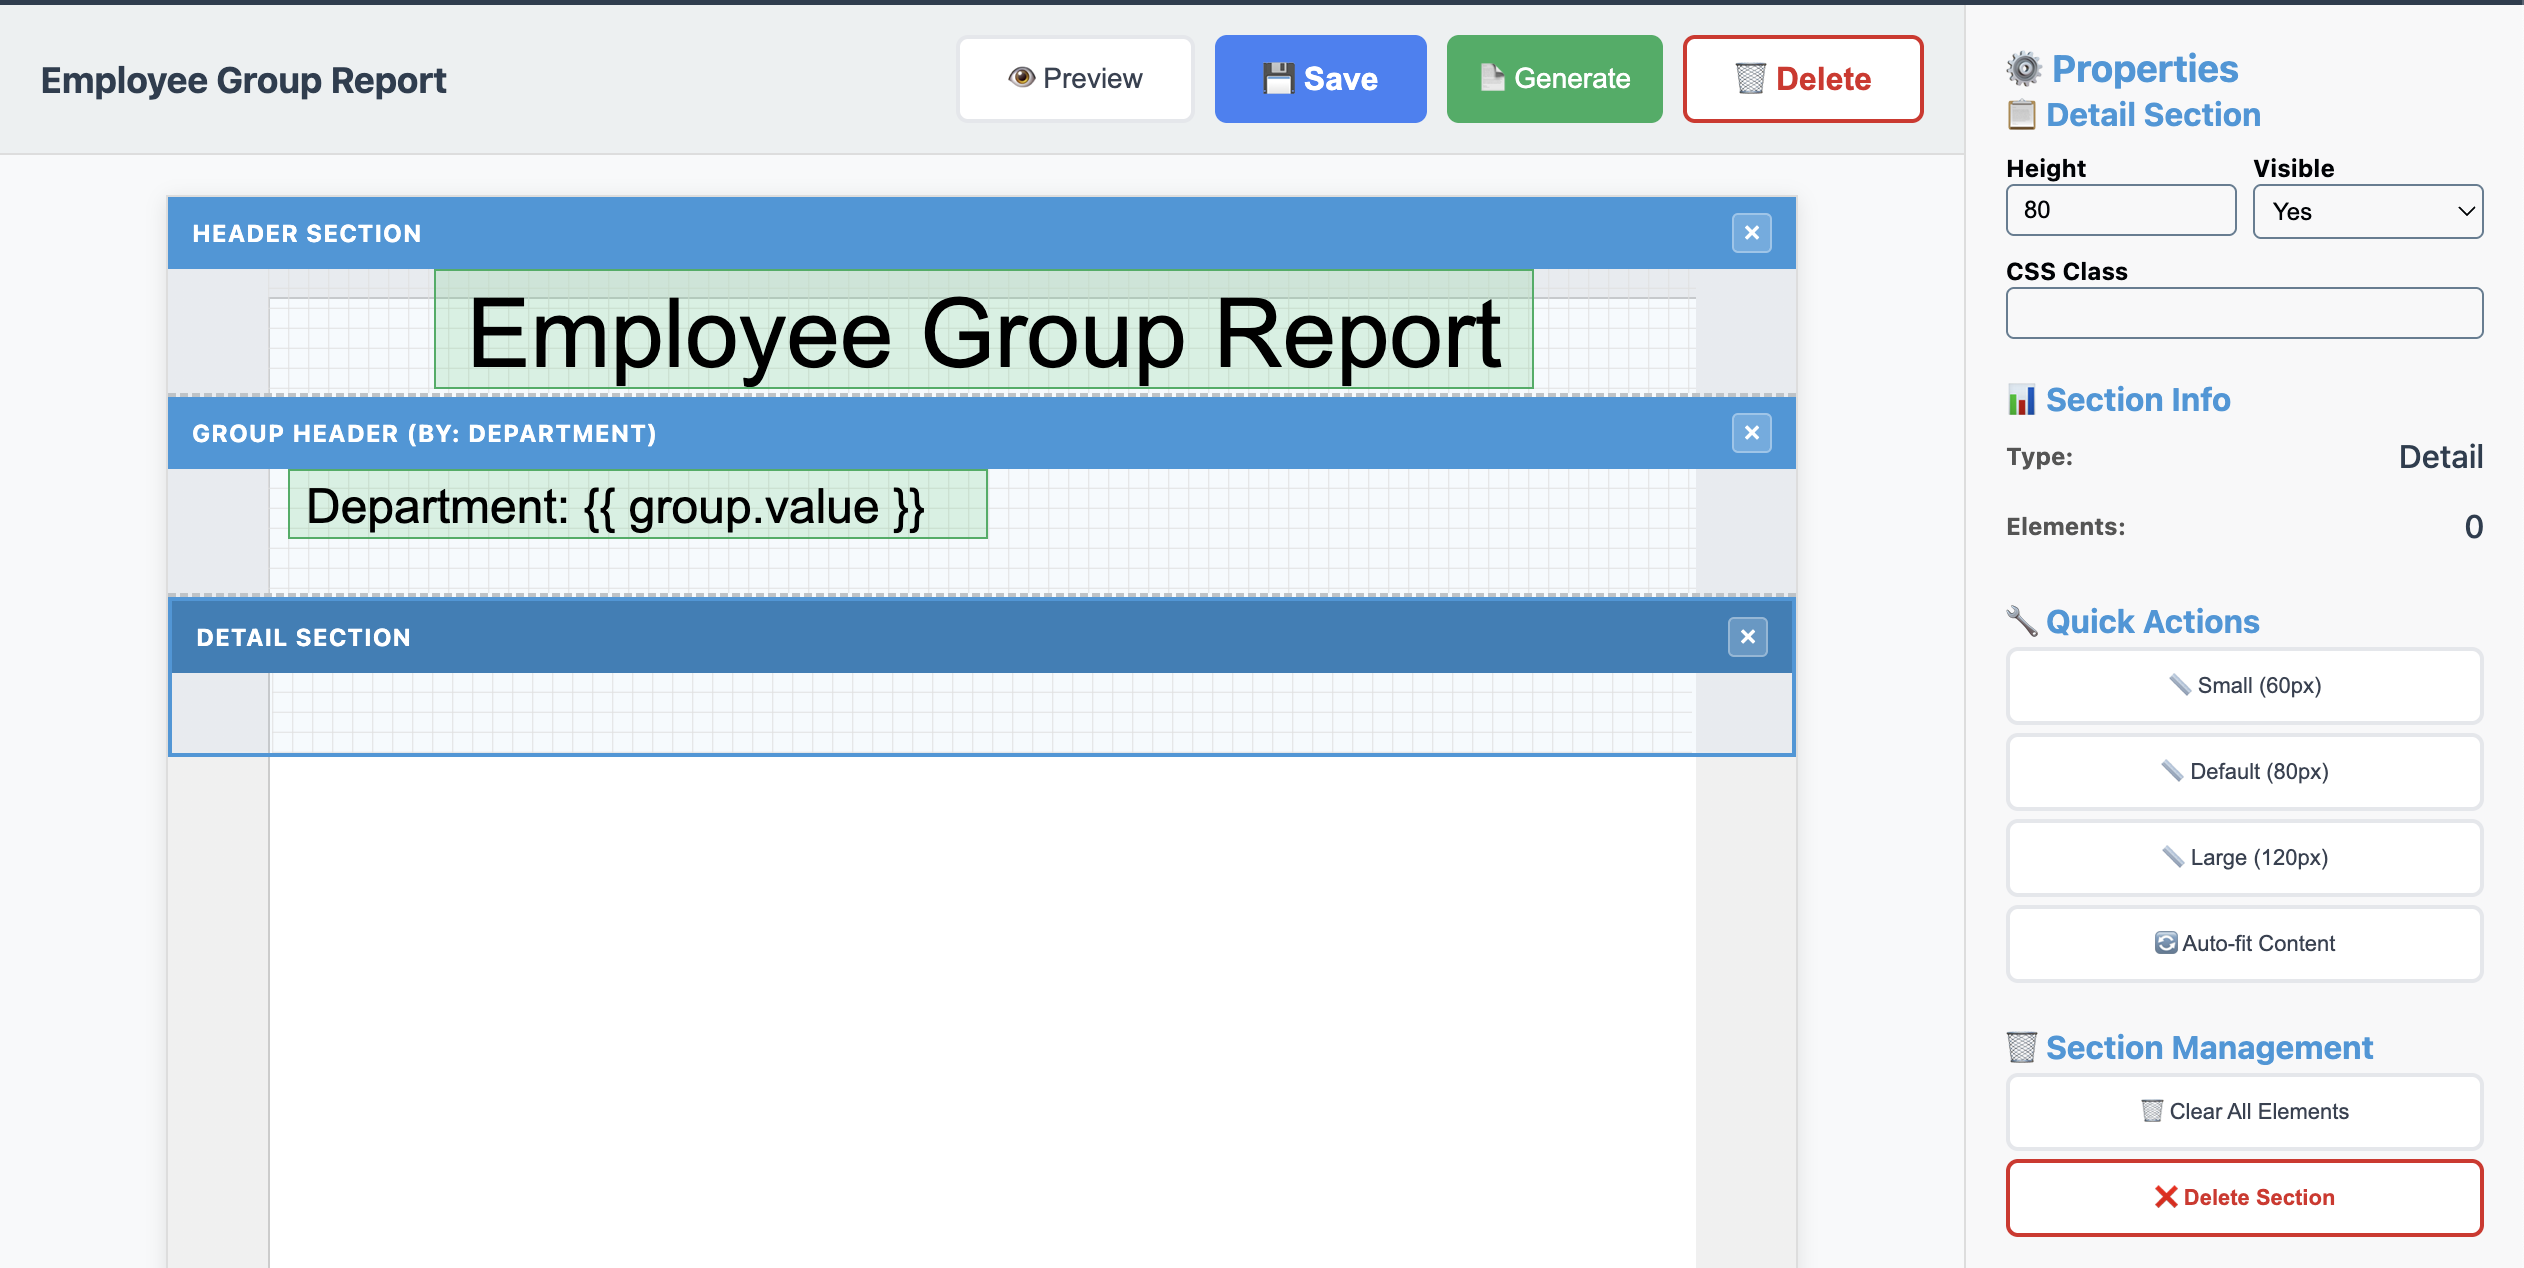
Step 6: Create the Detail Section
Now, let’s add a detail section.
- Click on the Detail button in the Sections part of the toolbar
- Set the properties:
- Height: 40
- Click the Save button
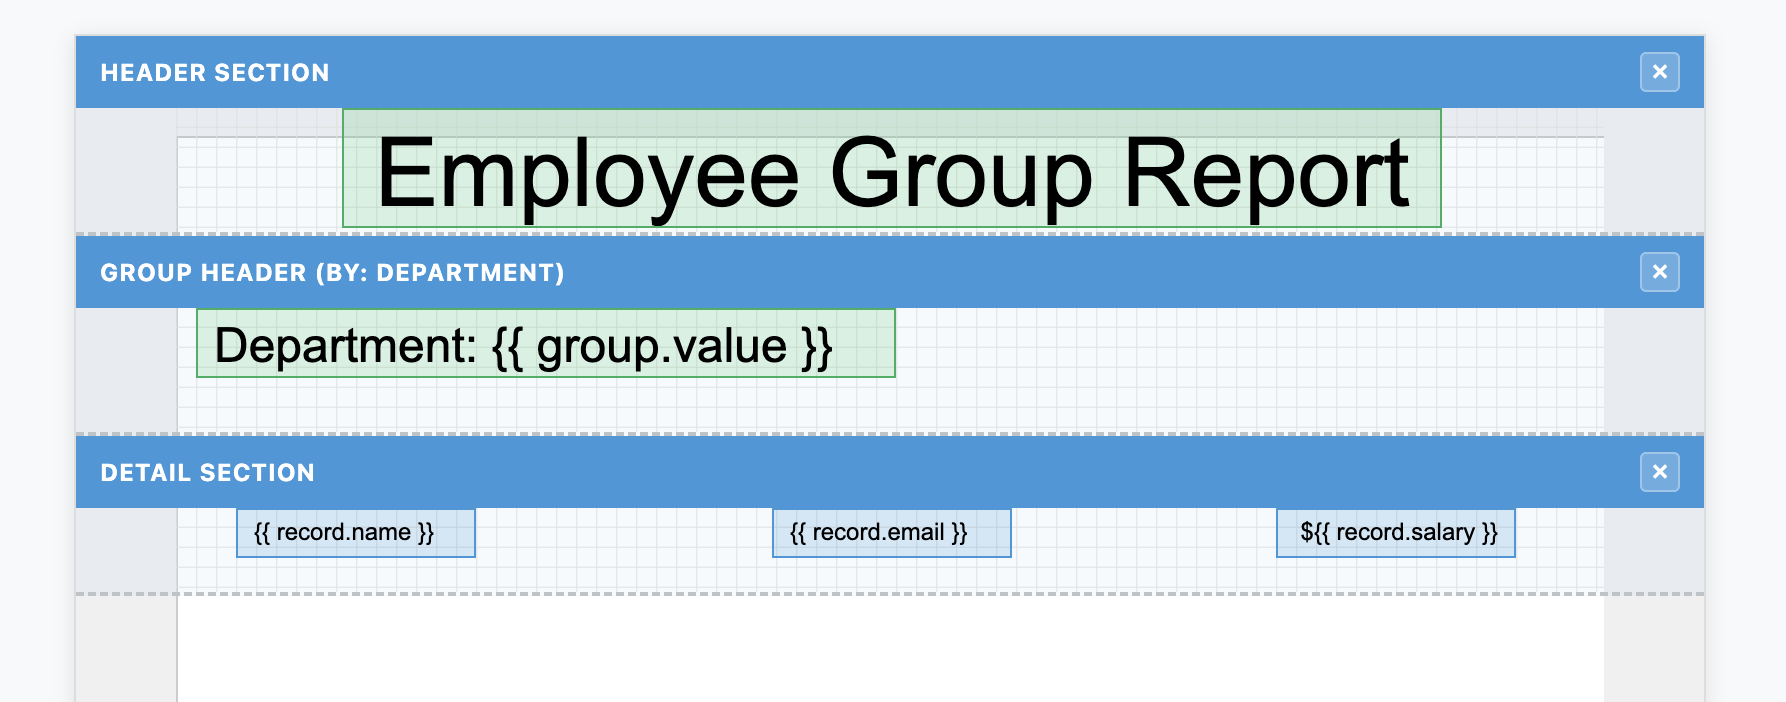
Step 7: Design the Employee Detail Section
Now, we’ll create the repeating section for individual employees.
- Make sure you’re in the Detail section
- Drag these fields from the Data Sources panel:
Employee Name
- Drag “name” field to X: 30, Y: 0
- Font Size: 12px
Employee Email
- Drag “email” field to X: 298, Y: 0
- Font Size: 12px
Employee Salary
- Drag “salary” field to X: 550, Y: 0
- Font Size: 12px
- Align: Right
- Text:
${{ record.salary }}(adds dollar sign)
Create Column Headers

Click on the
Generate Headersbutton under the sections toolbar. This will generate the column headers for each item added to the details section.Make sure all three column headers have:
- Font Weight: Bold
- Font Size: 14px
- Align Bottom?: Yes
Ensure
salary:- Align: Right
Add Separator Line

- Select the Line tool (➖)
- Draw a horizontal line below the headers
- Properties:
- X: 8
- Width: 700
- Height: 2
- Align Bottom?: Yes
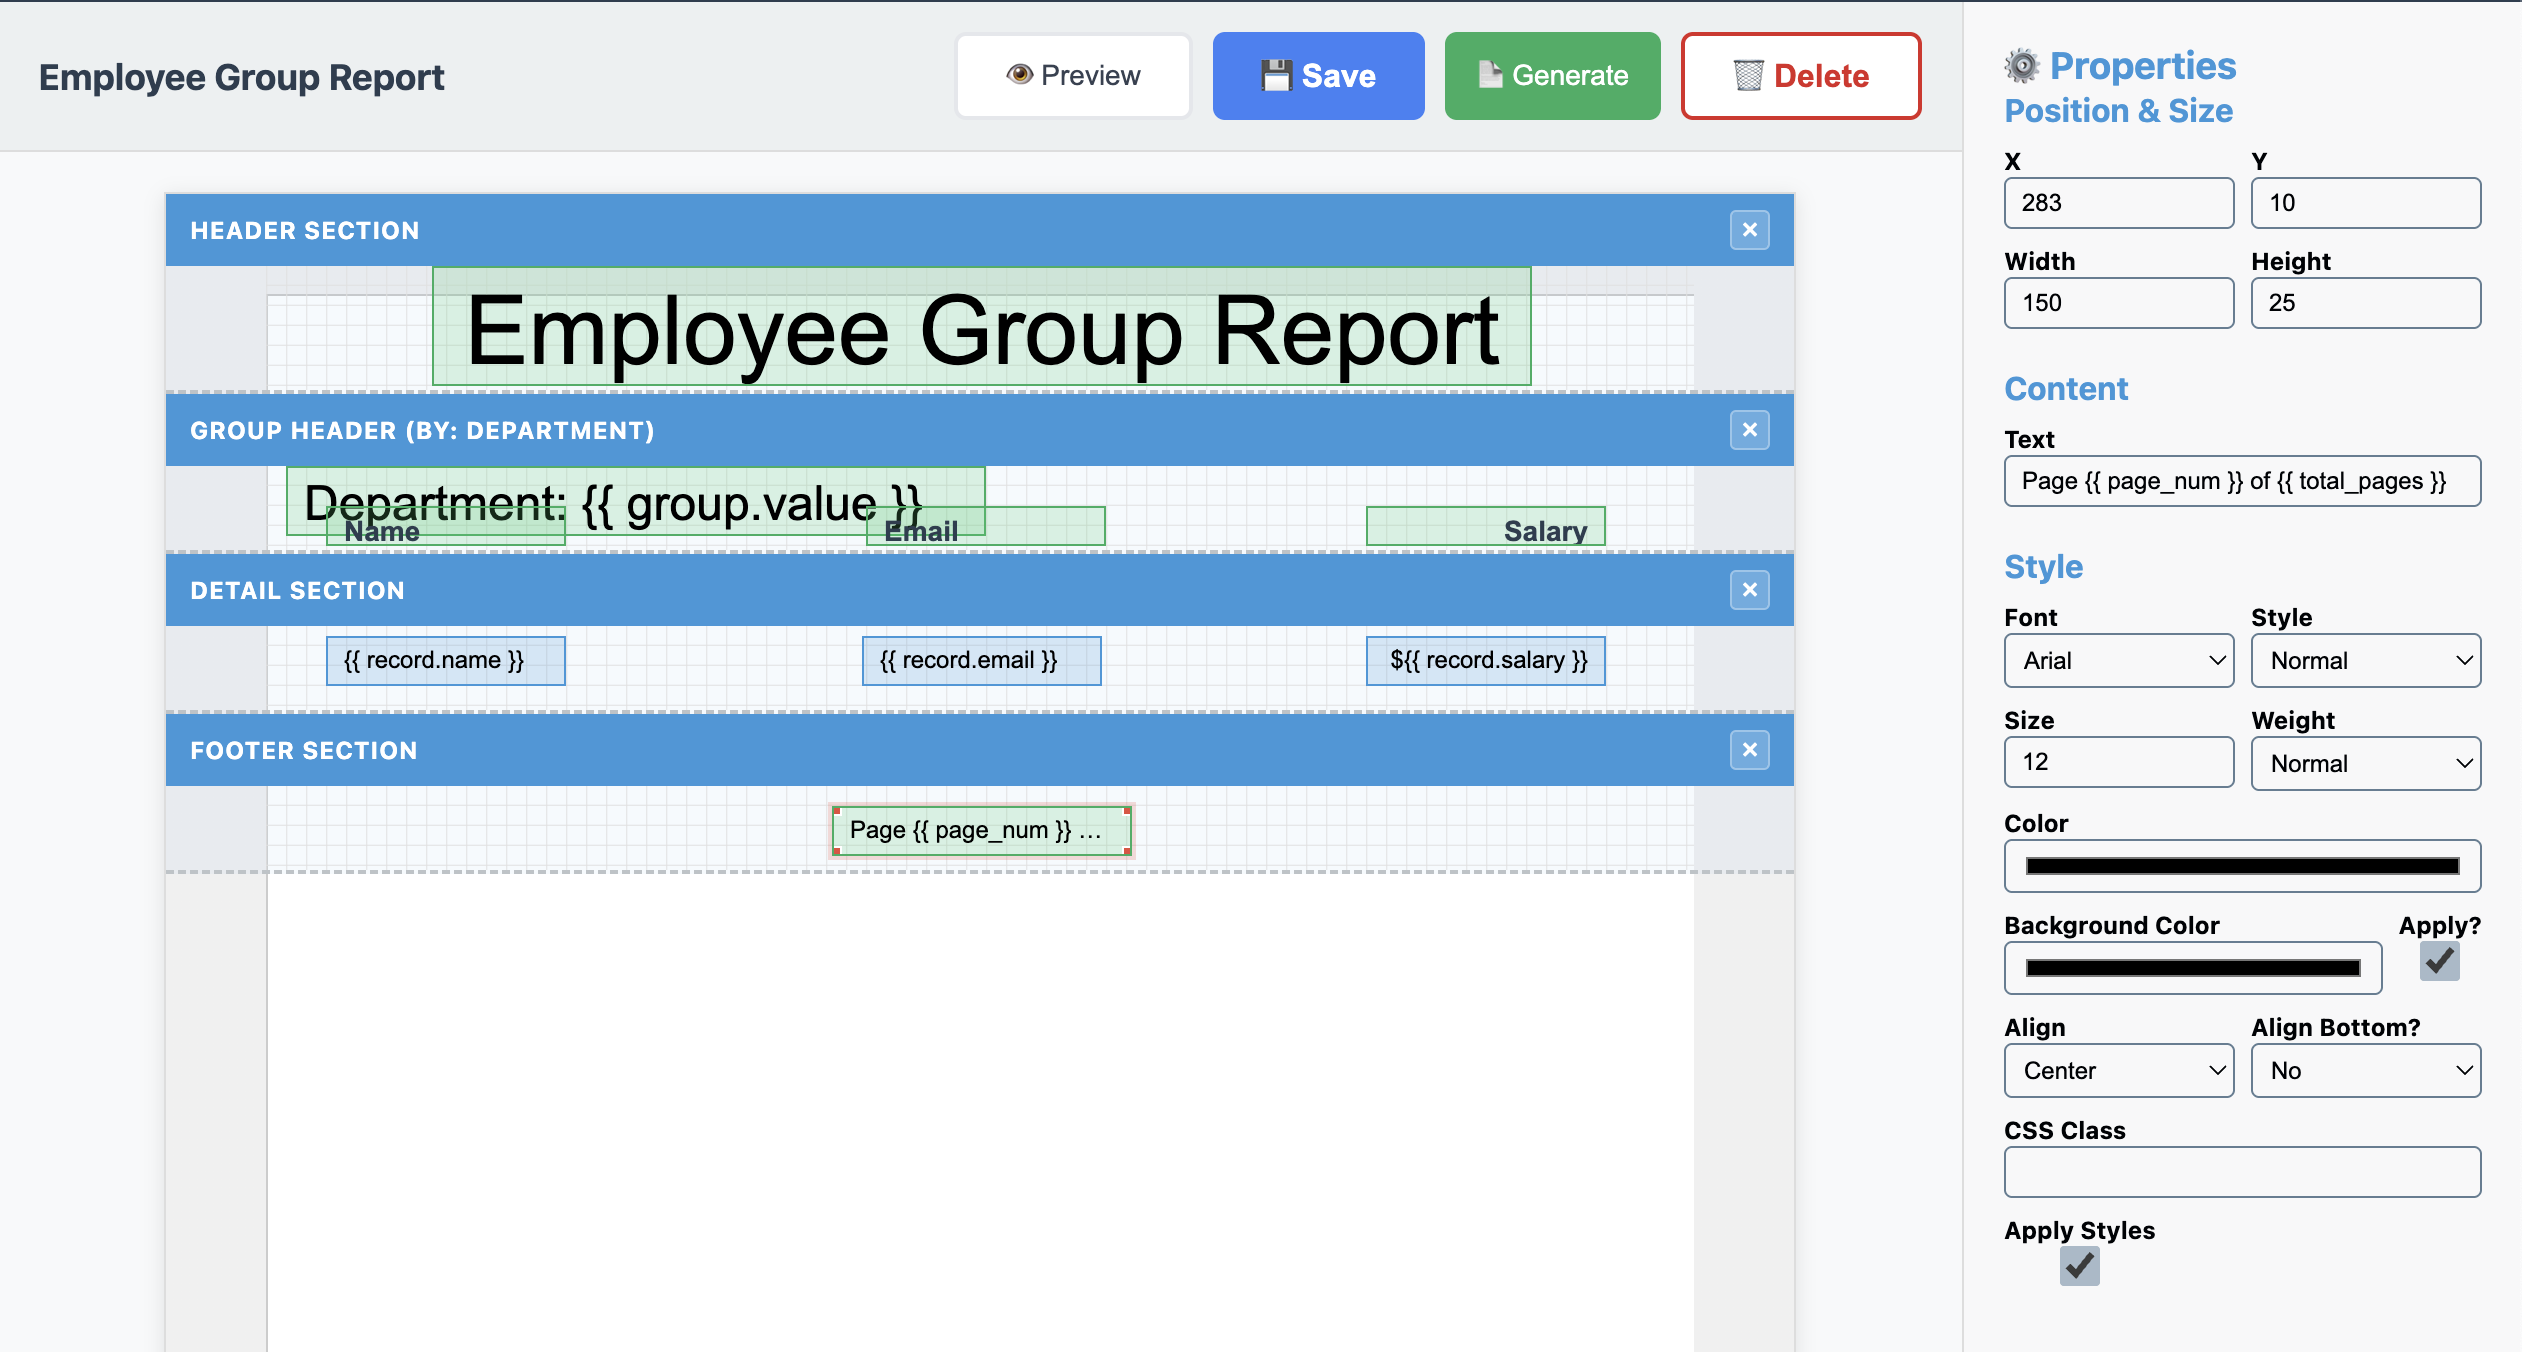
Step 8: Add Page Footer
Let’s add page numbering to handle multi-page reports.

- Click “Footer” in the Sections panel
- Click “Save” to save your progress
- Add a Text element
- Set content to:
Page {{ page_num }} of {{ total_pages }} - Set the properties:
- X: 283
- Y: 10
- Font Size: 12px
- Align: Center
Step 9: Fine-Tune the Layout
Now let’s make sure everything is perfectly aligned.
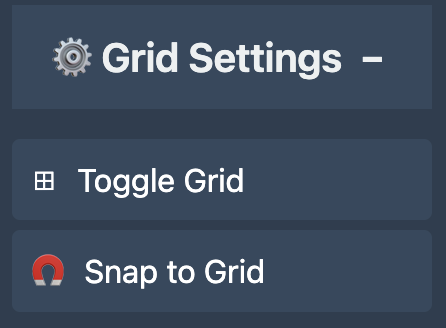
- Enable the grid view (⊞) for precise alignment
- Turn on snap-to-grid (🧲)
- Adjust spacing between sections if needed
- Ensure all columns are properly aligned
Pro Tips: - Keep consistent spacing between elements - Make sure field widths in the detail section match header widths - Use the preview frequently to check alignment
Step 10: Preview Your Report
Time to see your grouped report in action!

- Click the “Preview” button (👁️)
- You should see the report layout with placeholders for rendering

Step 11: Save and Generate

- Click “Save” (💾) to save your template
- Click “Generate” (📄) to create a PDF
Understanding Grouping
The power of grouping in Informa Designer: - Automatic Organization: Data is automatically organized by your chosen field - Group Headers: Repeat for each unique value (each department) - Visual Hierarchy: Creates clear sections in your report - Scalability: Works with any number of departments
Advanced Techniques
Adding Department Summaries
You could add a group footer to show: - Total employees per department - Average salary per department - Department contact information
Multi-Level Grouping
Group by department, then by job title for more detailed organization.
Conditional Formatting
Highlight high-performers or salary ranges using conditional expressions:
{{ record.salary > 100000 ? 'high-salary' : '' }}
Dynamic Styling
Apply different colors to different departments using expressions in your styles.
Common Use Cases
This grouping pattern works great for: - Sales Reports: Group by region or salesperson - Inventory Reports: Group by category or warehouse - Student Reports: Group by class or grade level - Project Reports: Group by status or team - Financial Reports: Group by account type or period
Troubleshooting
Issue: Groups not appearing - Verify your data has the grouping field - Check that the field name matches exactly - Ensure data source is properly connected
Issue: Misaligned columns - Use snap-to-grid for precise positioning - Check that detail fields match header positions - Preview frequently during design
Conclusion
You’ve successfully created a professional employee report with automatic department grouping! This fundamental technique opens up countless possibilities for organizing and presenting your data clearly.
The visual report designer makes it easy to create complex grouped reports without writing code, while the template engine handles all the grouping logic automatically.
Next Steps
- Explore Group Footers: Add summary information for each department
- Try Nested Groups: Create multi-level grouping hierarchies
- Add Charts: Include department statistics visualizations
- Customize Styling: Apply your company’s branding
Ready to create more sophisticated reports? Check out our other tutorials or dive into the template library for inspiration!
Need help with your reports? Join our community or contact support - we’re here to help you succeed!