Creating a Master-Detail Customer Orders Report with Informa Designer
Published: June 10, 2025
Reading Time: 10 minutes
Author: The Informa Designer Team
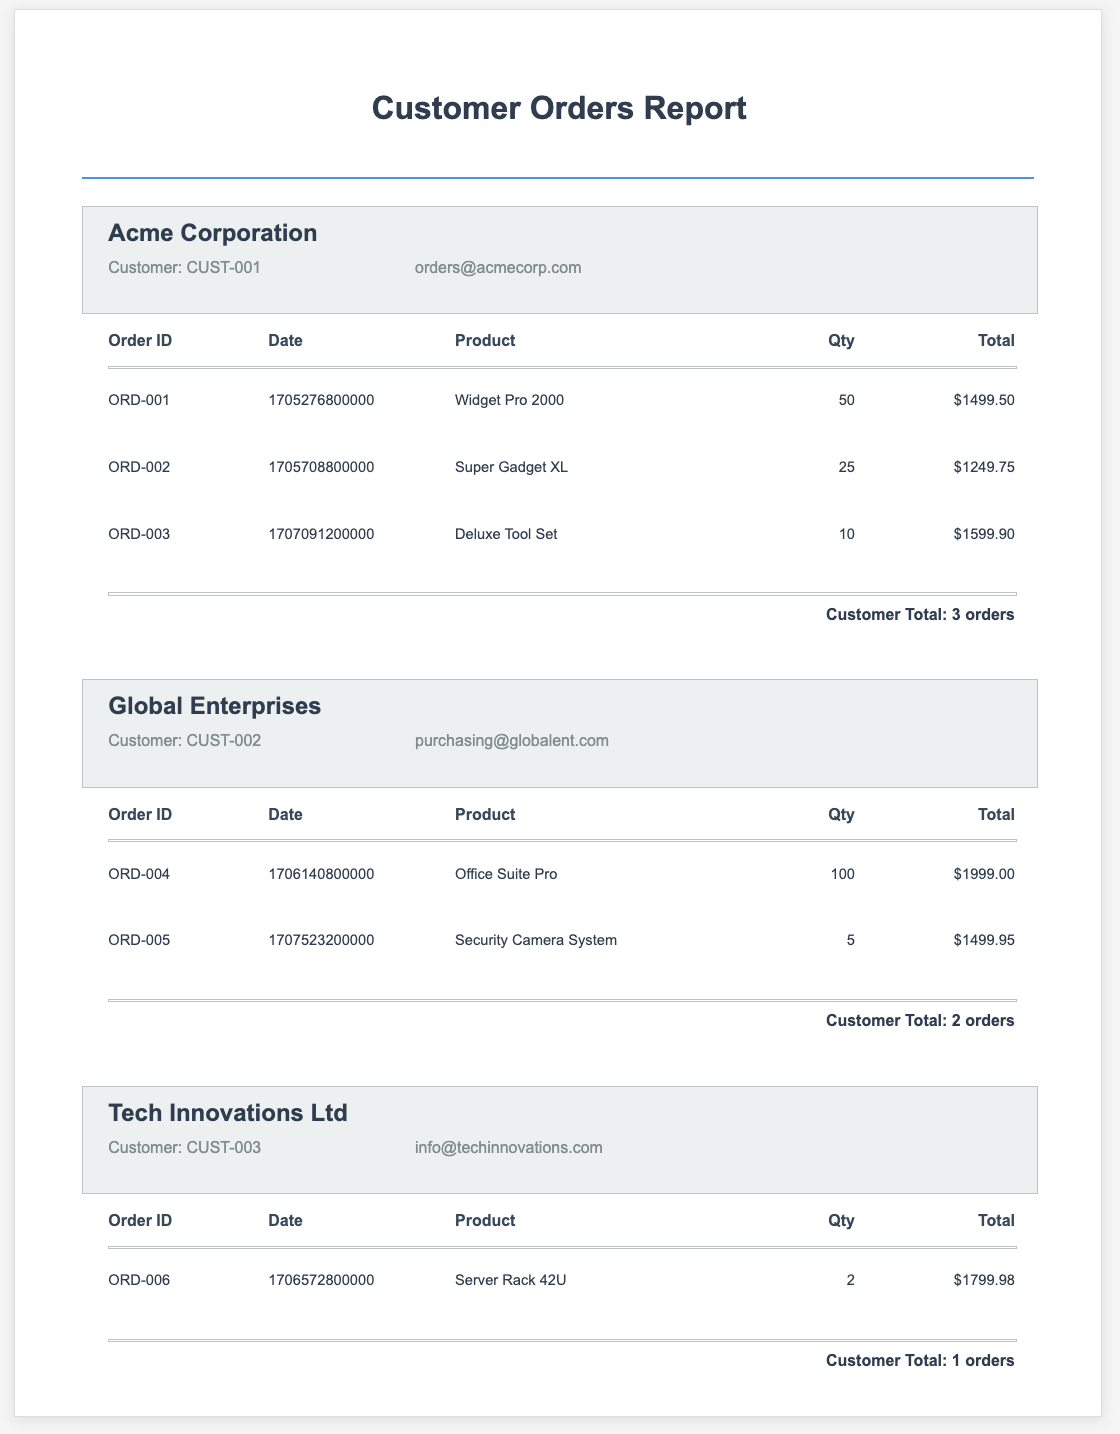
Creating professional reports doesn’t have to involve complex coding or expensive software. In this tutorial, we’ll walk through building a master-detail customer orders report using Informa Designer’s visual report builder. This type of report is perfect for businesses that need to group orders by customer, showing customer details followed by their order history.
What We’ll Build
By the end of this tutorial, you’ll have created a professional customer orders report that: - Groups orders by customer - Shows customer information in a styled header - Lists all orders for each customer - Includes order totals and counts - Automatically handles page breaks - Looks polished and print-ready
Prerequisites
- An Informa Designer account (free tier works perfectly)
- A MongoDB database with customer and order data
- Basic understanding of report concepts (headers, details, footers)
Step 1: Create a New Report Template
First, log into your Informa Designer dashboard and create a new report template.
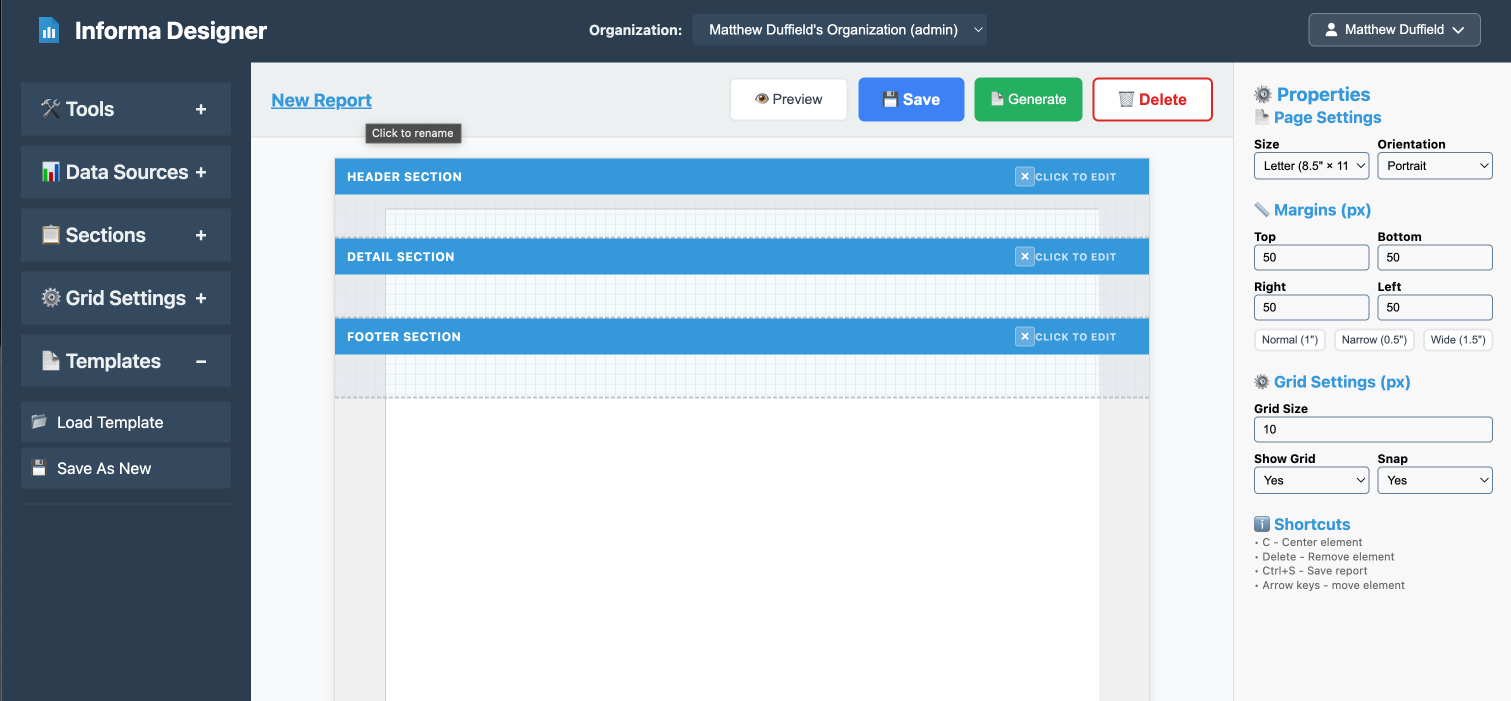
- Click the “New Report” button
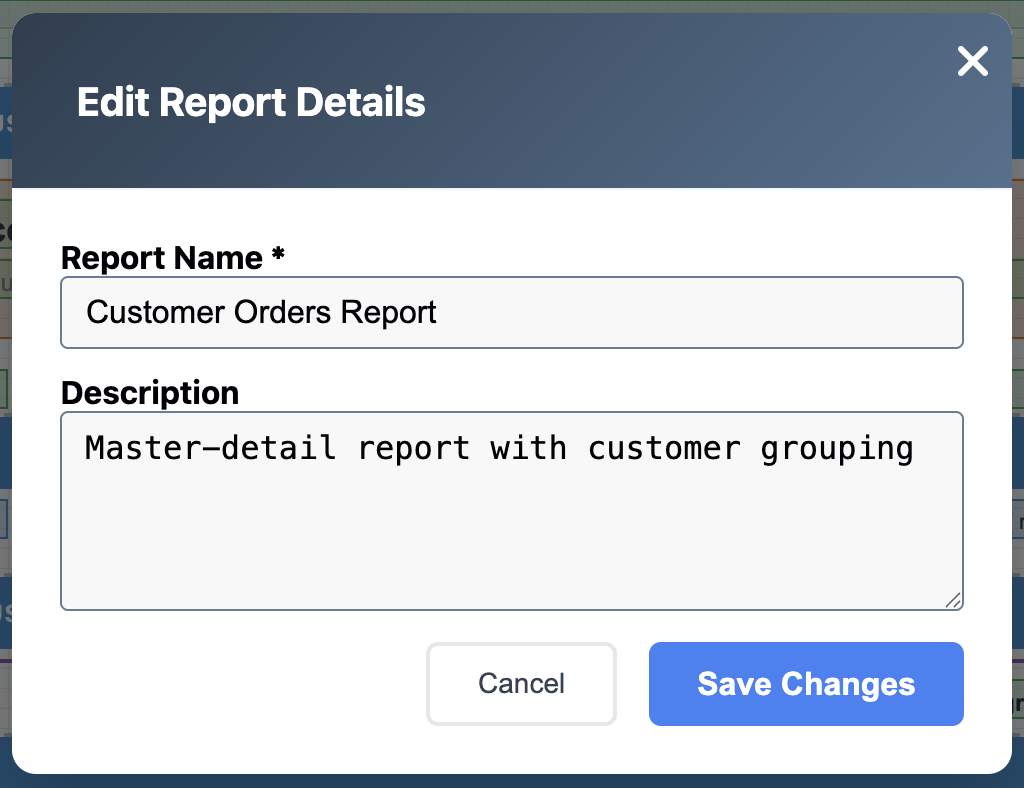
- Give your report a meaningful name: “Customer Orders Report”
- Add a description: “Master-detail report with customer grouping”
- Click “Save Changes”
Step 2: Set Up Your Data Source
Before designing the layout, we need to connect to our data source.
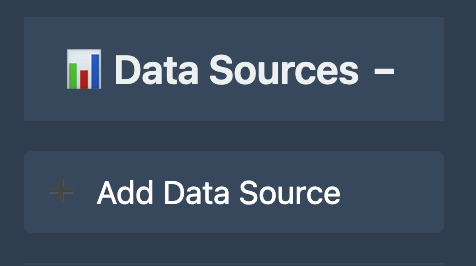
- In the left toolbar, find the Data Sources section
- Click “Add Data Source”
- Configure your MongoDB connection:
- Name: “CustomerOrders”
- Collection: “orders”
- Query:
{}(to fetch all orders)
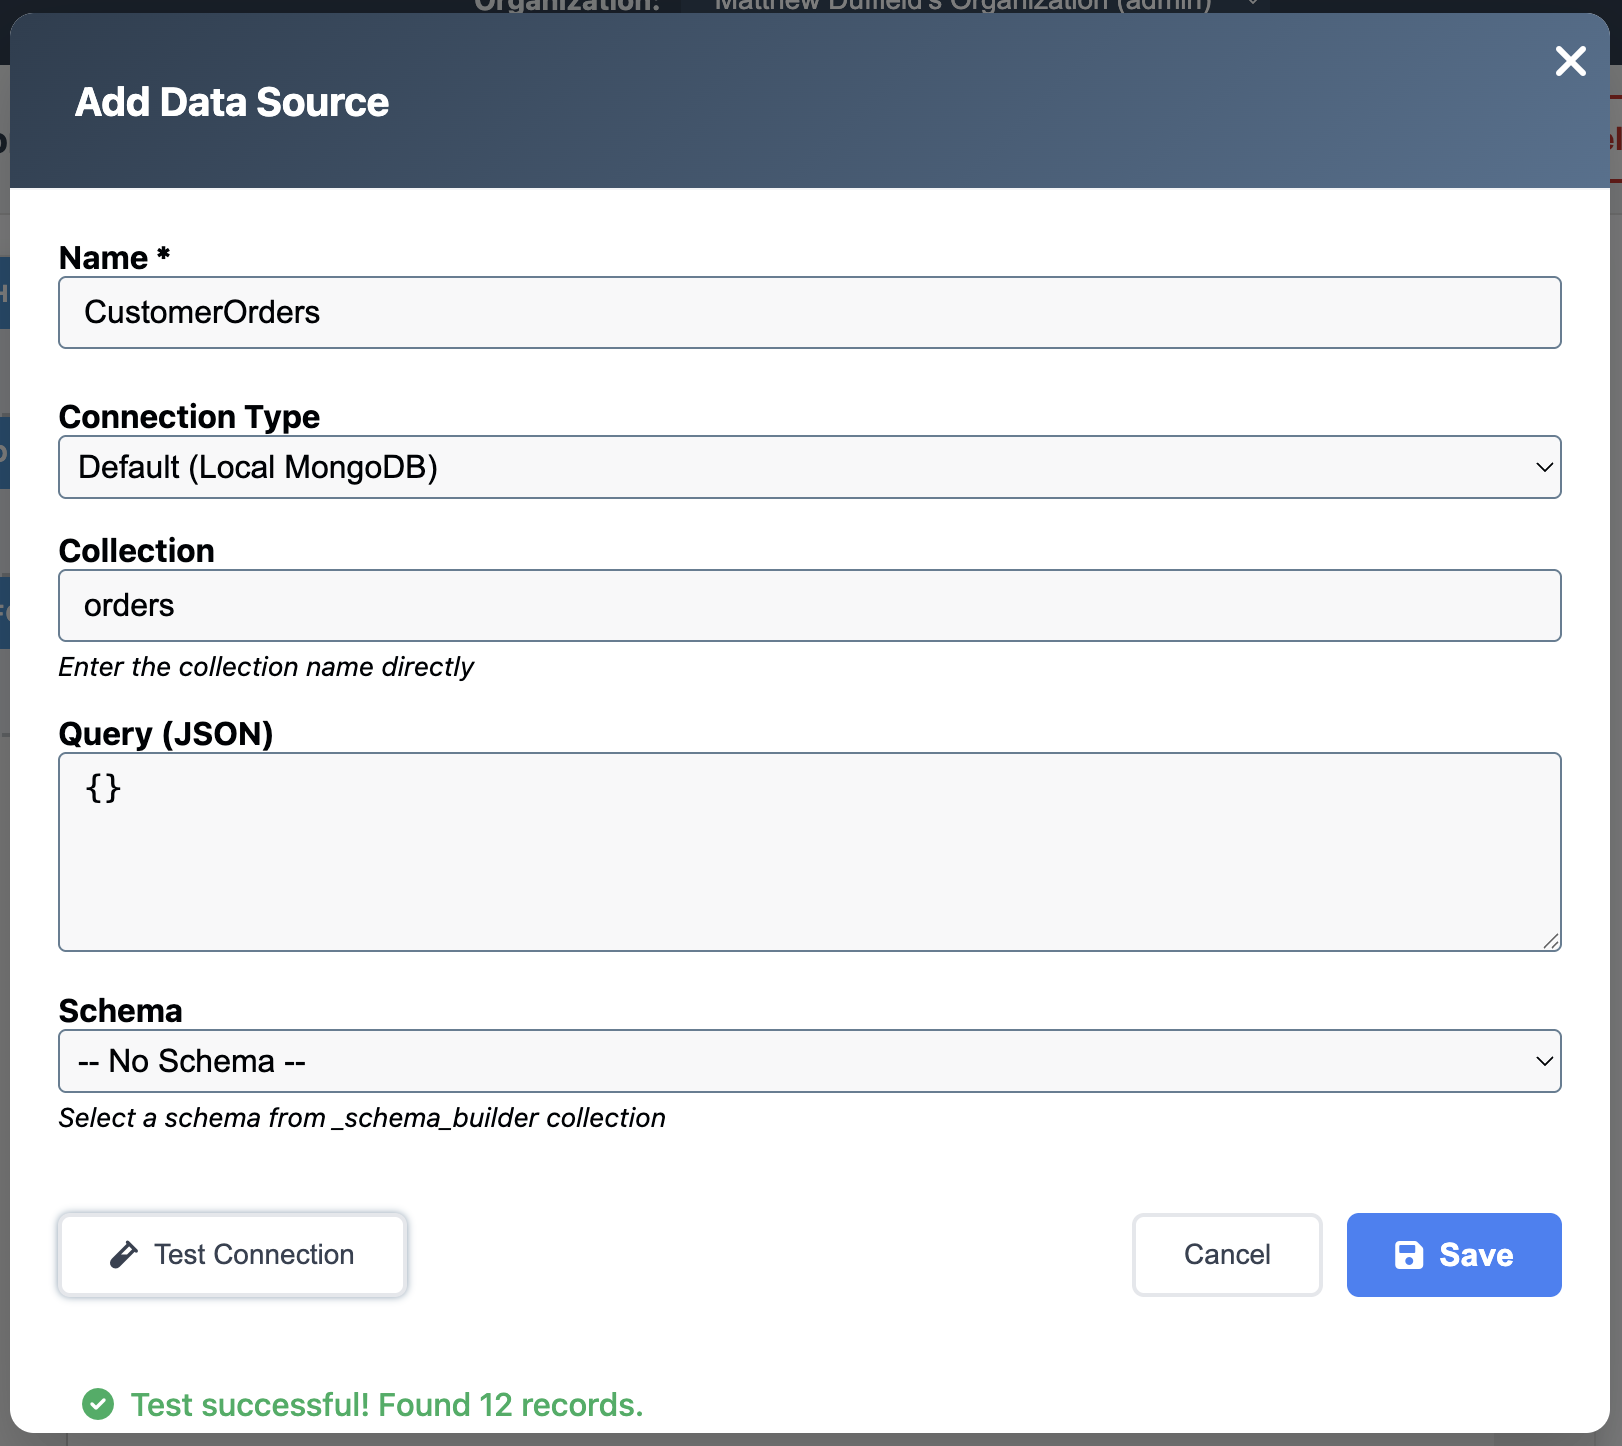
- Click “Save” to add the data source
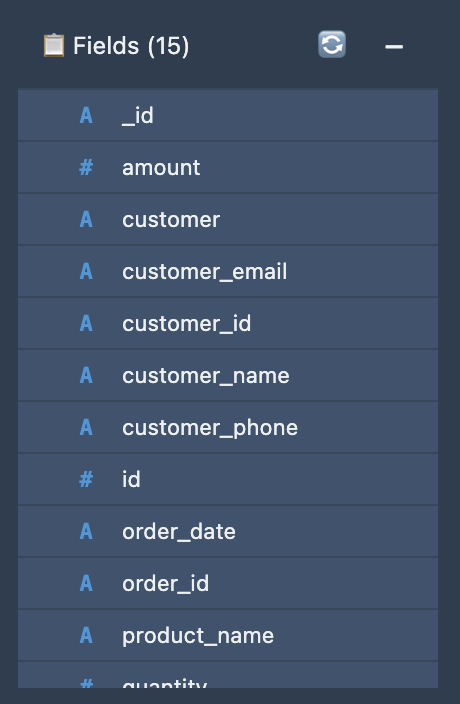
- Click the refresh button (🔄) to discover available fields
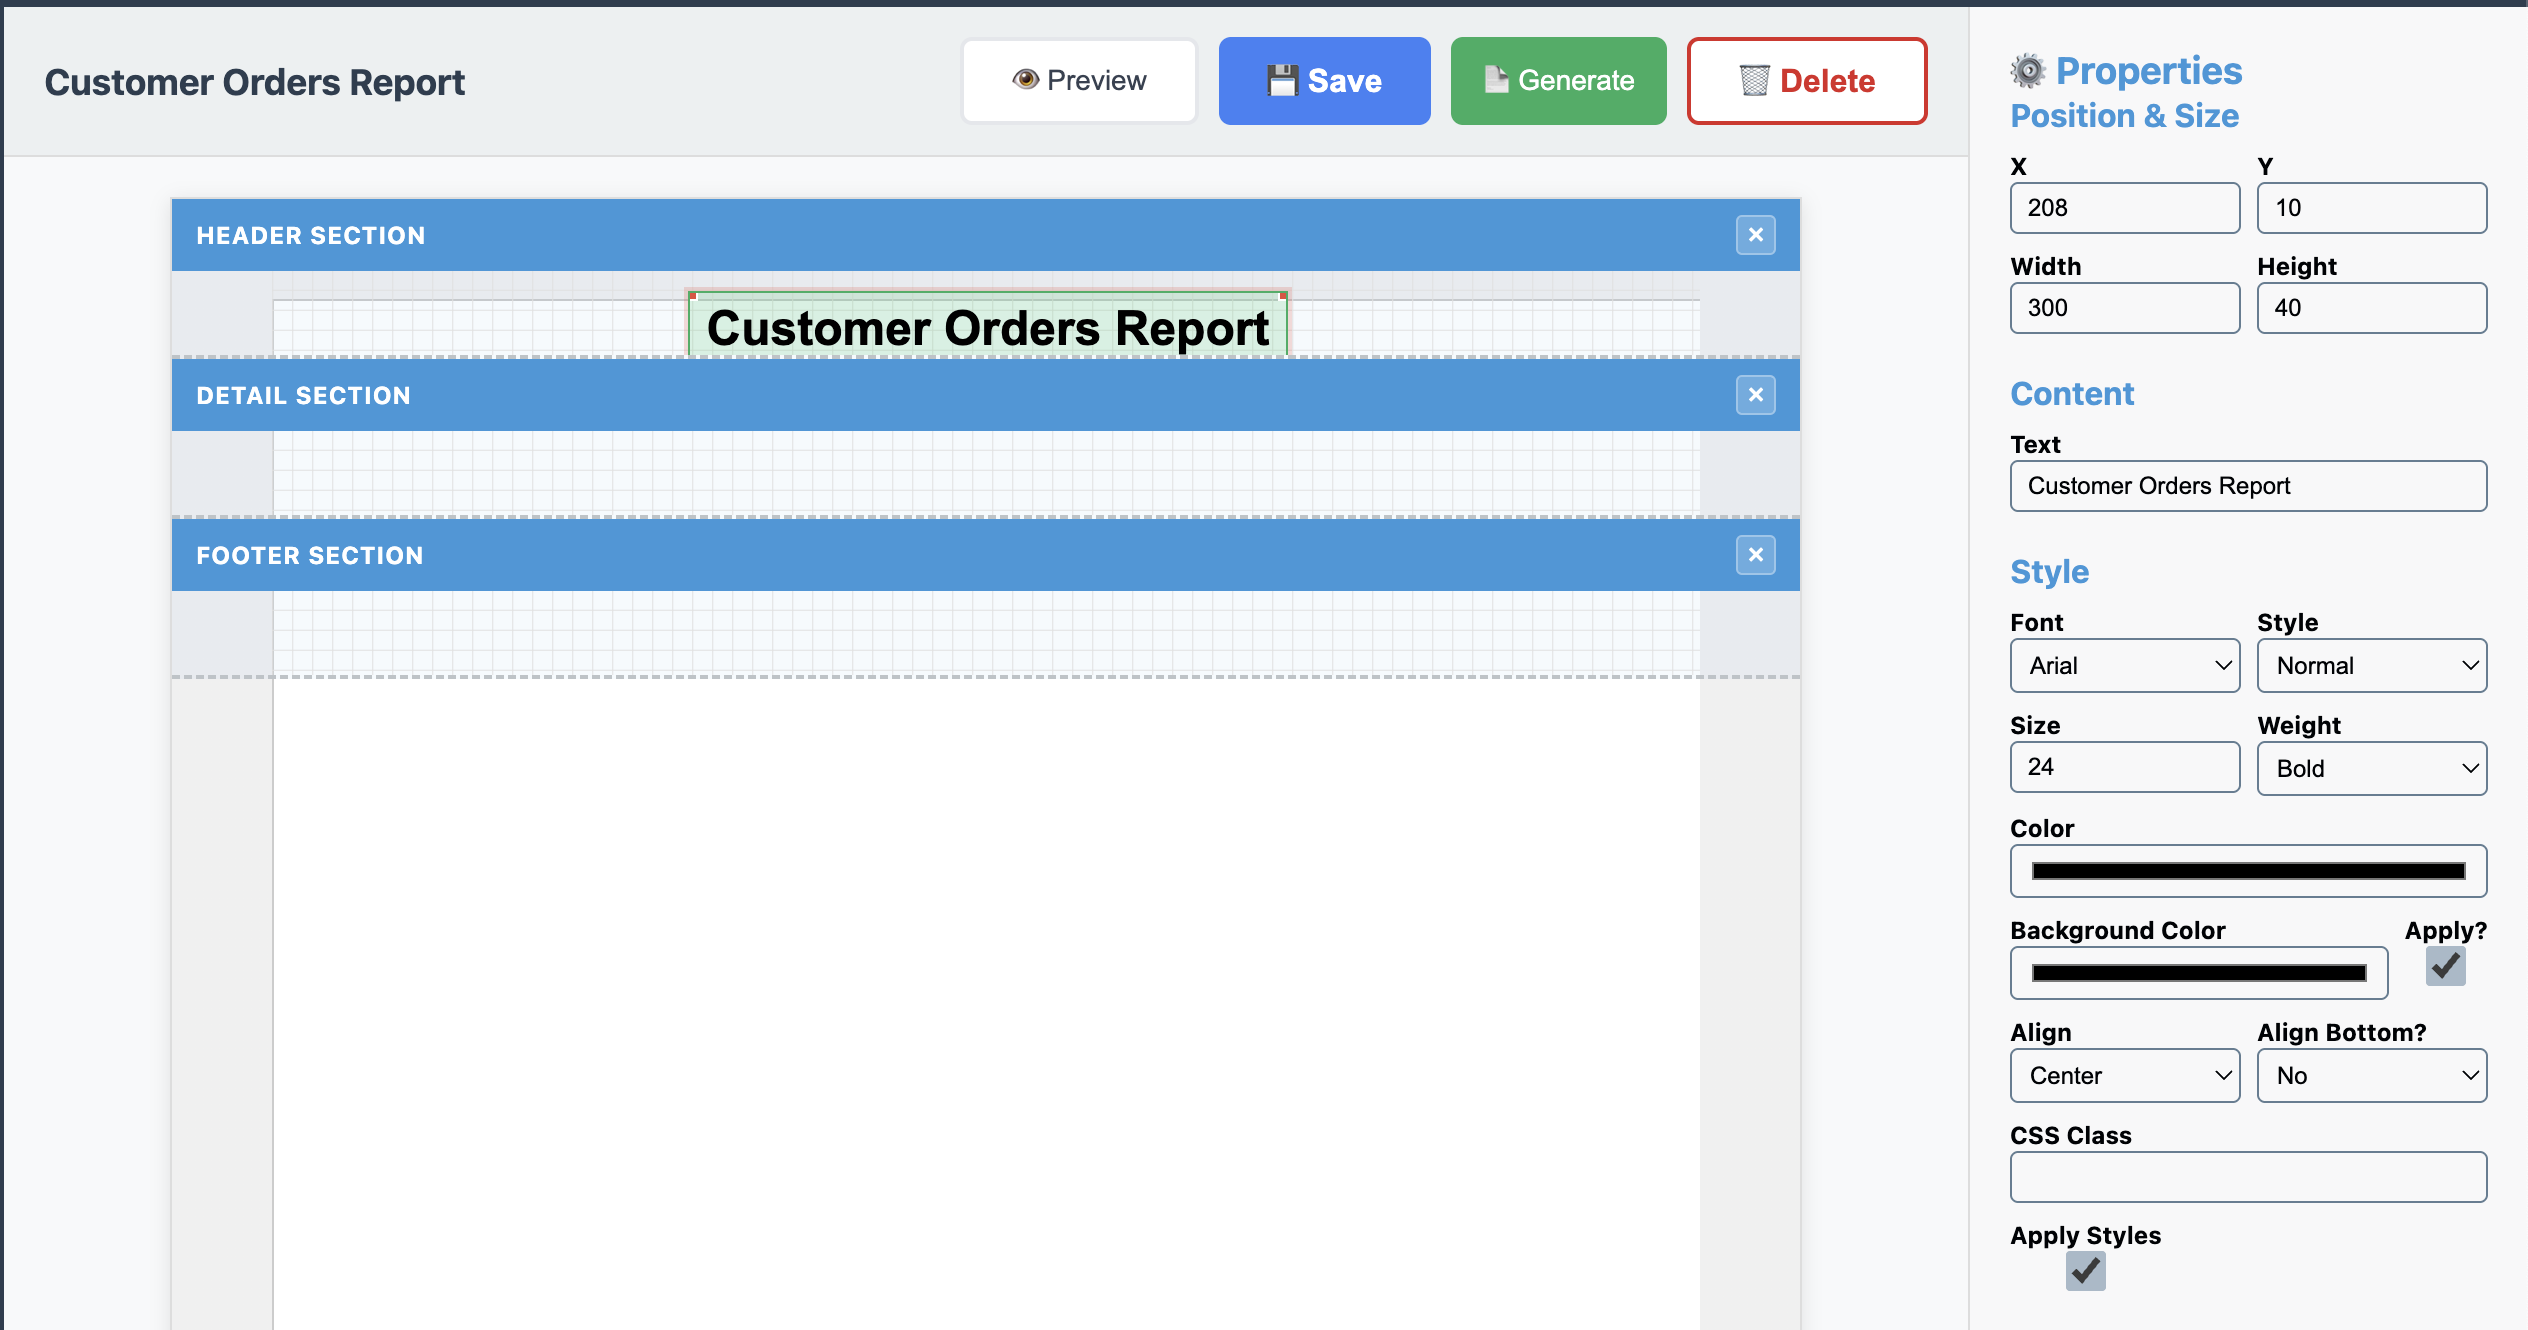
Step 3: Design the Report Header
Let’s start with a professional header for our report.
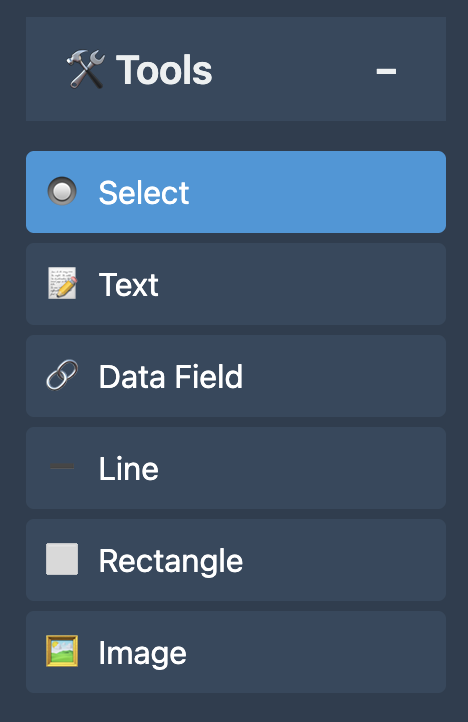
- In the Tools section, click on Text (📝)
- Click and drag on the canvas to create a text element
- Set the properties:
- Content: “Customer Orders Report”
- Width: 300
- Height: 40
- Font Size: 24px
- Font Weight: Bold
- Text Align: Center
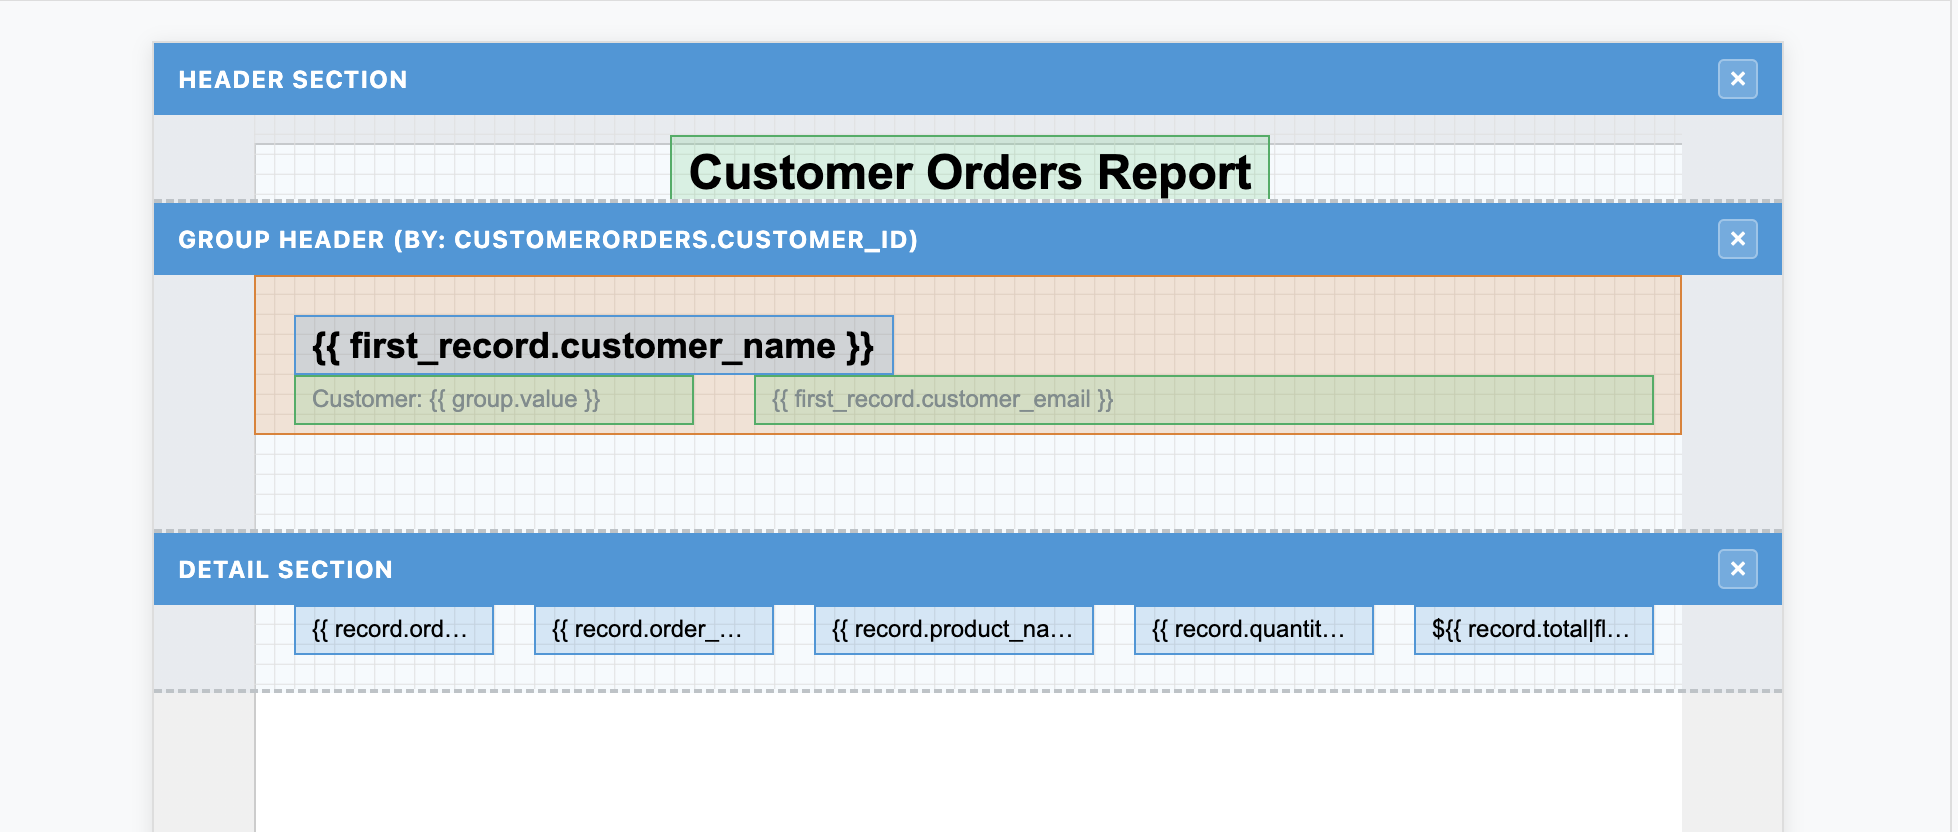
Step 4: Create the Group Header Section
This is where the magic happens. We’ll create a section that repeats for each customer.
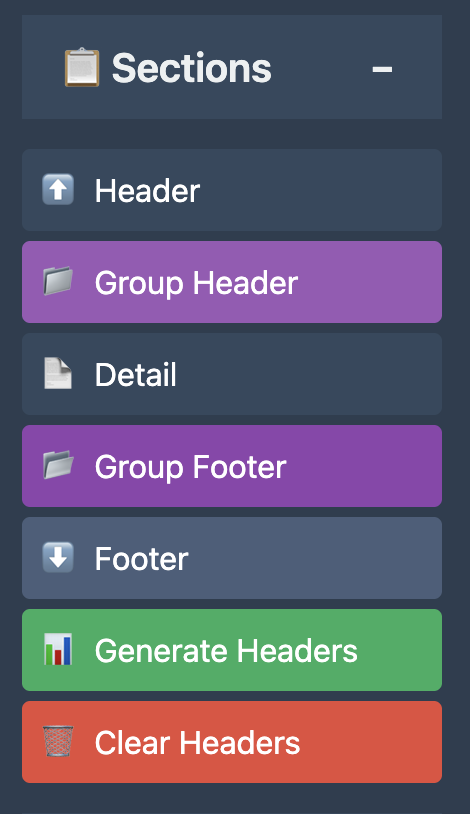
- In the Sections panel, click “Group Header”
- A modal will appear asking for grouping configuration
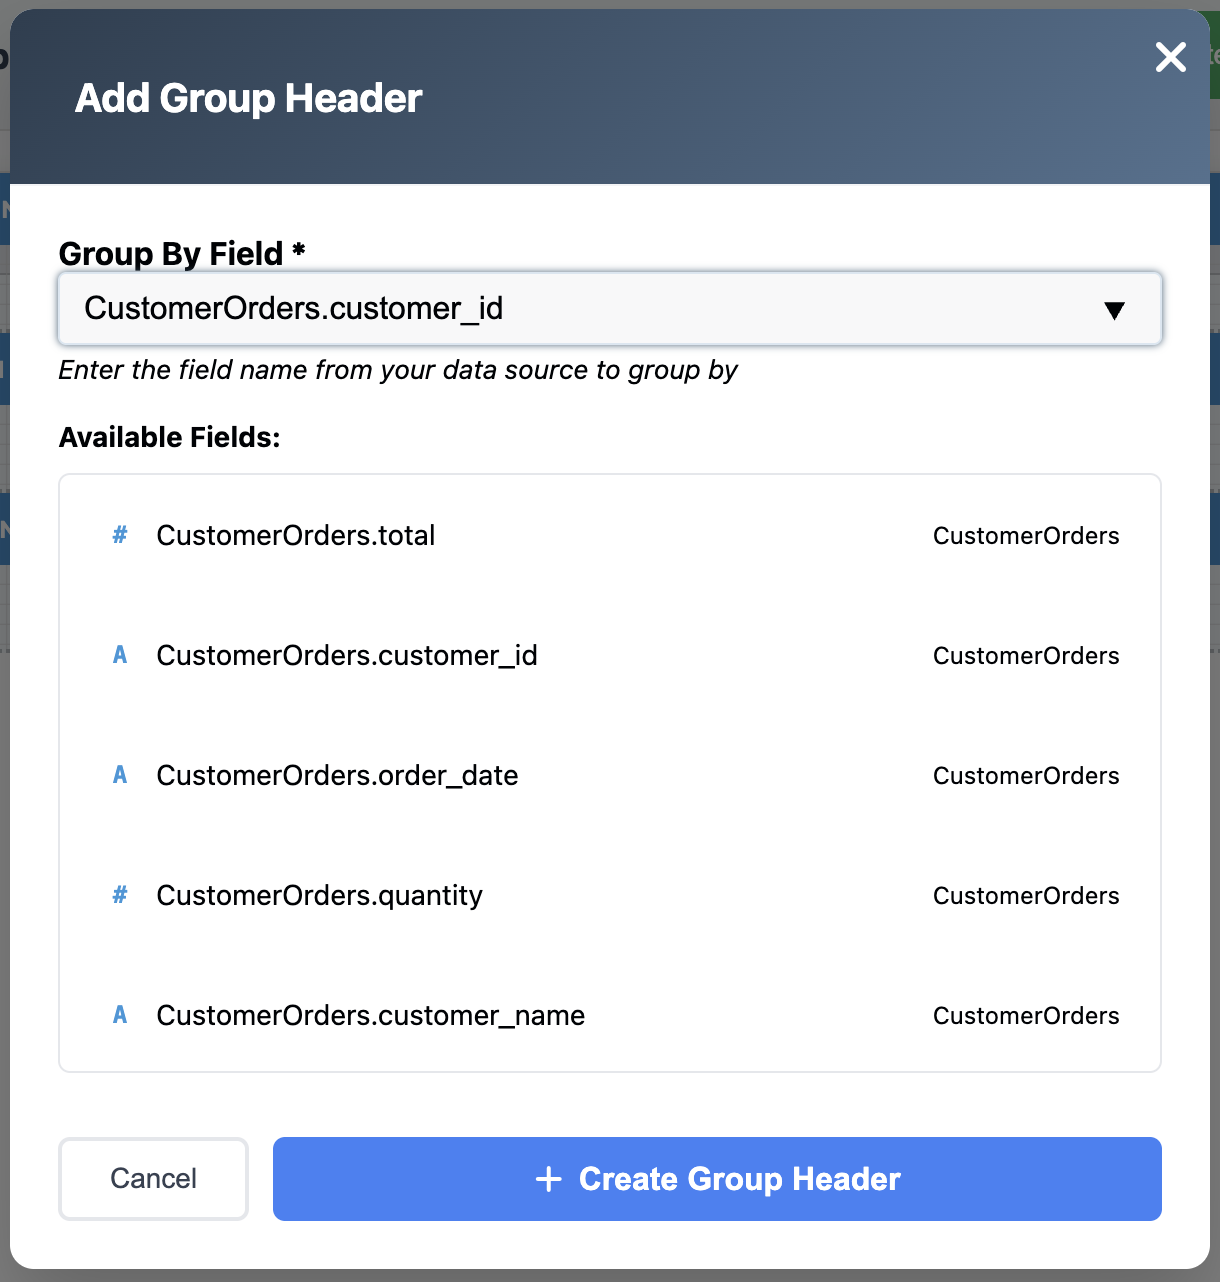
- Select “customer_id” as the grouping field
- Click “Create”
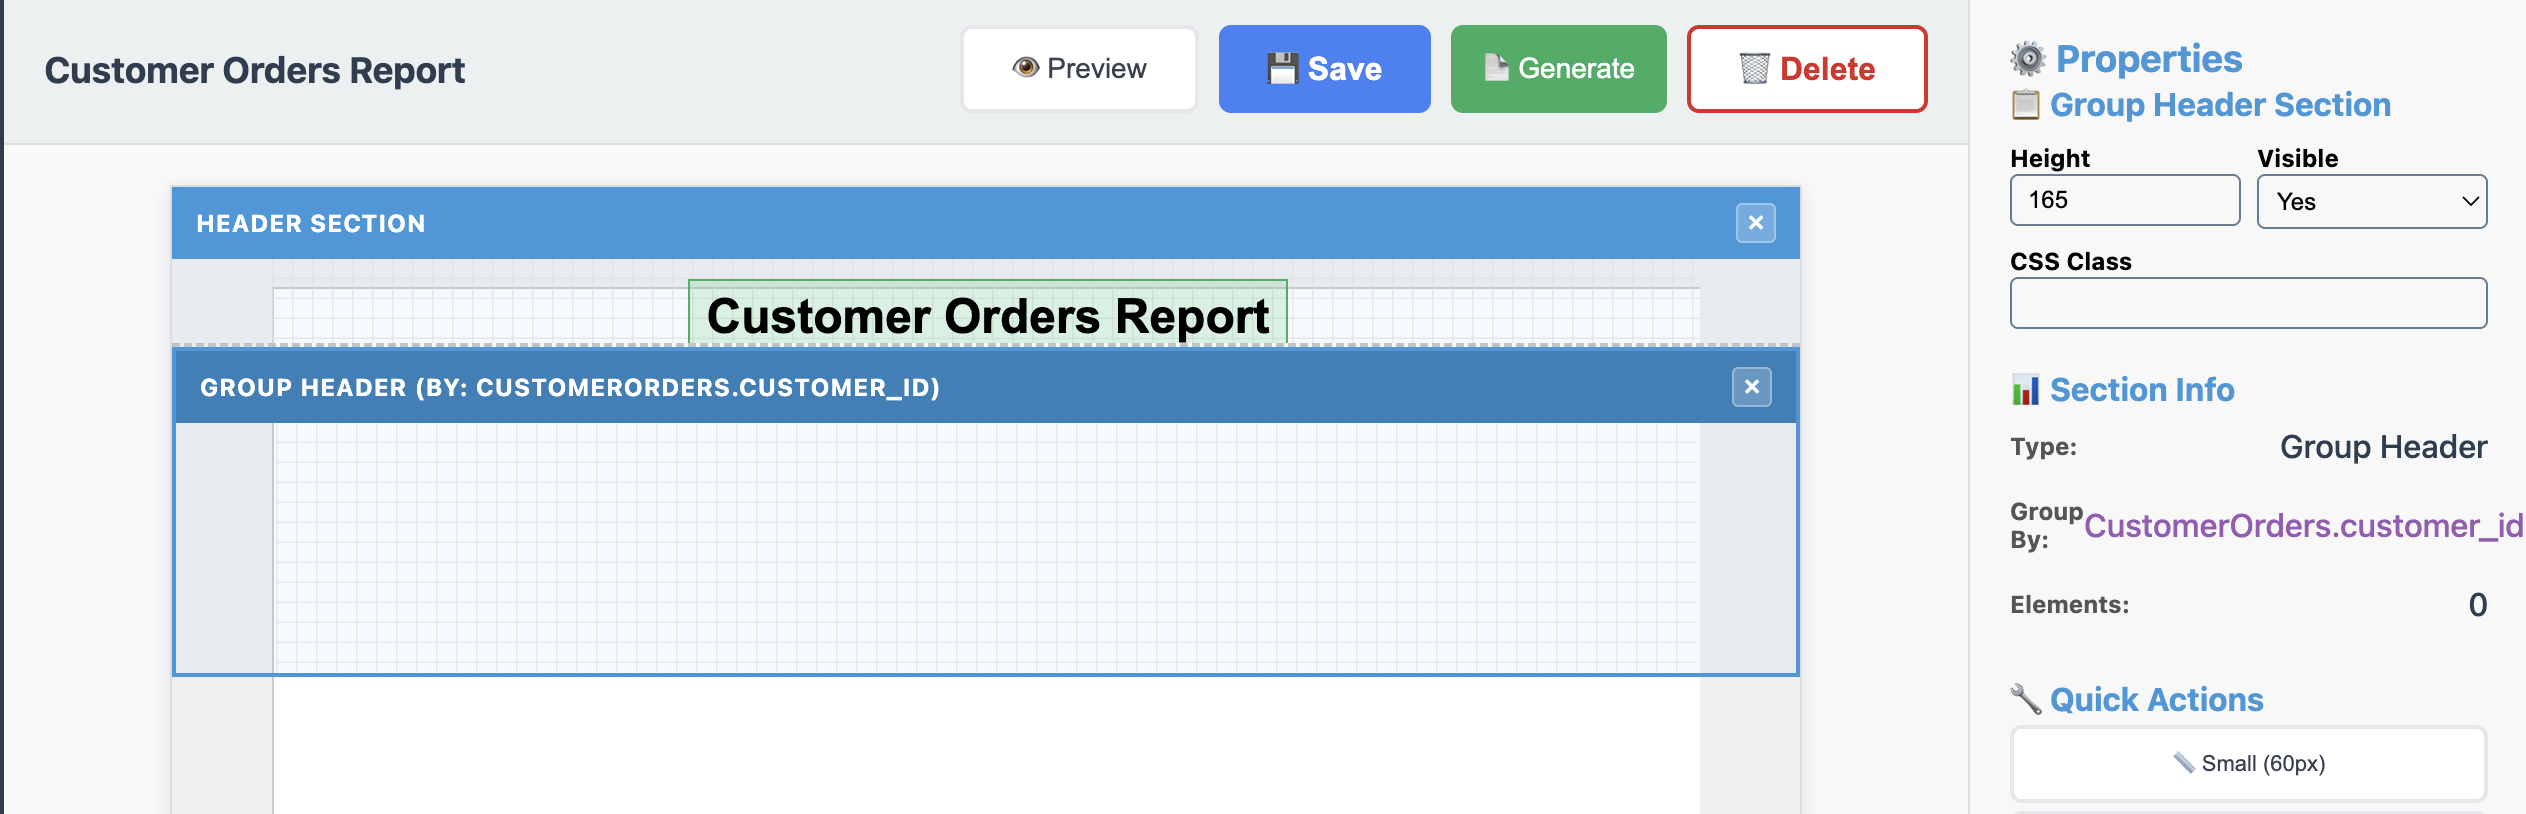
Note - you may need to remove the Detail and Footer sections so that things look correctly.
- Adjust the “Height” to 165
- Adjust the “Visible” to Yes
Now let’s design the customer information section:
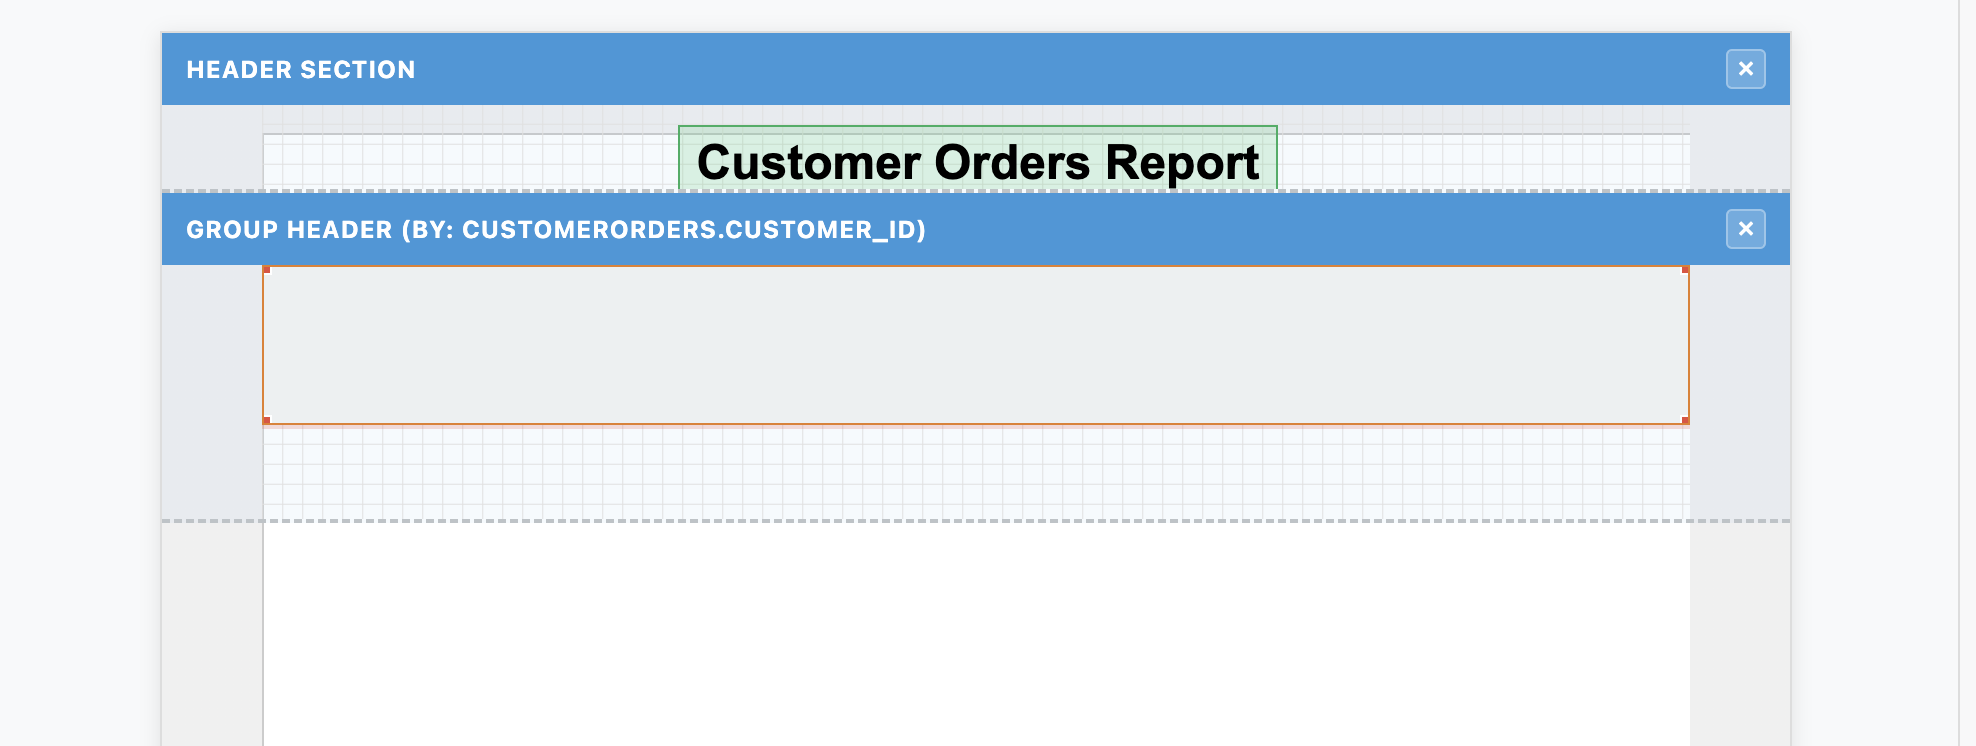
Add Background Rectangle
- Select the Rectangle tool (⬜)
- Draw a rectangle that spans the width of the group header
- Set properties:
- Background Color: #ecf0f1
- Border Color: #bdc3c7
- Border Width: 1px
- Width: 714
- Height: 80
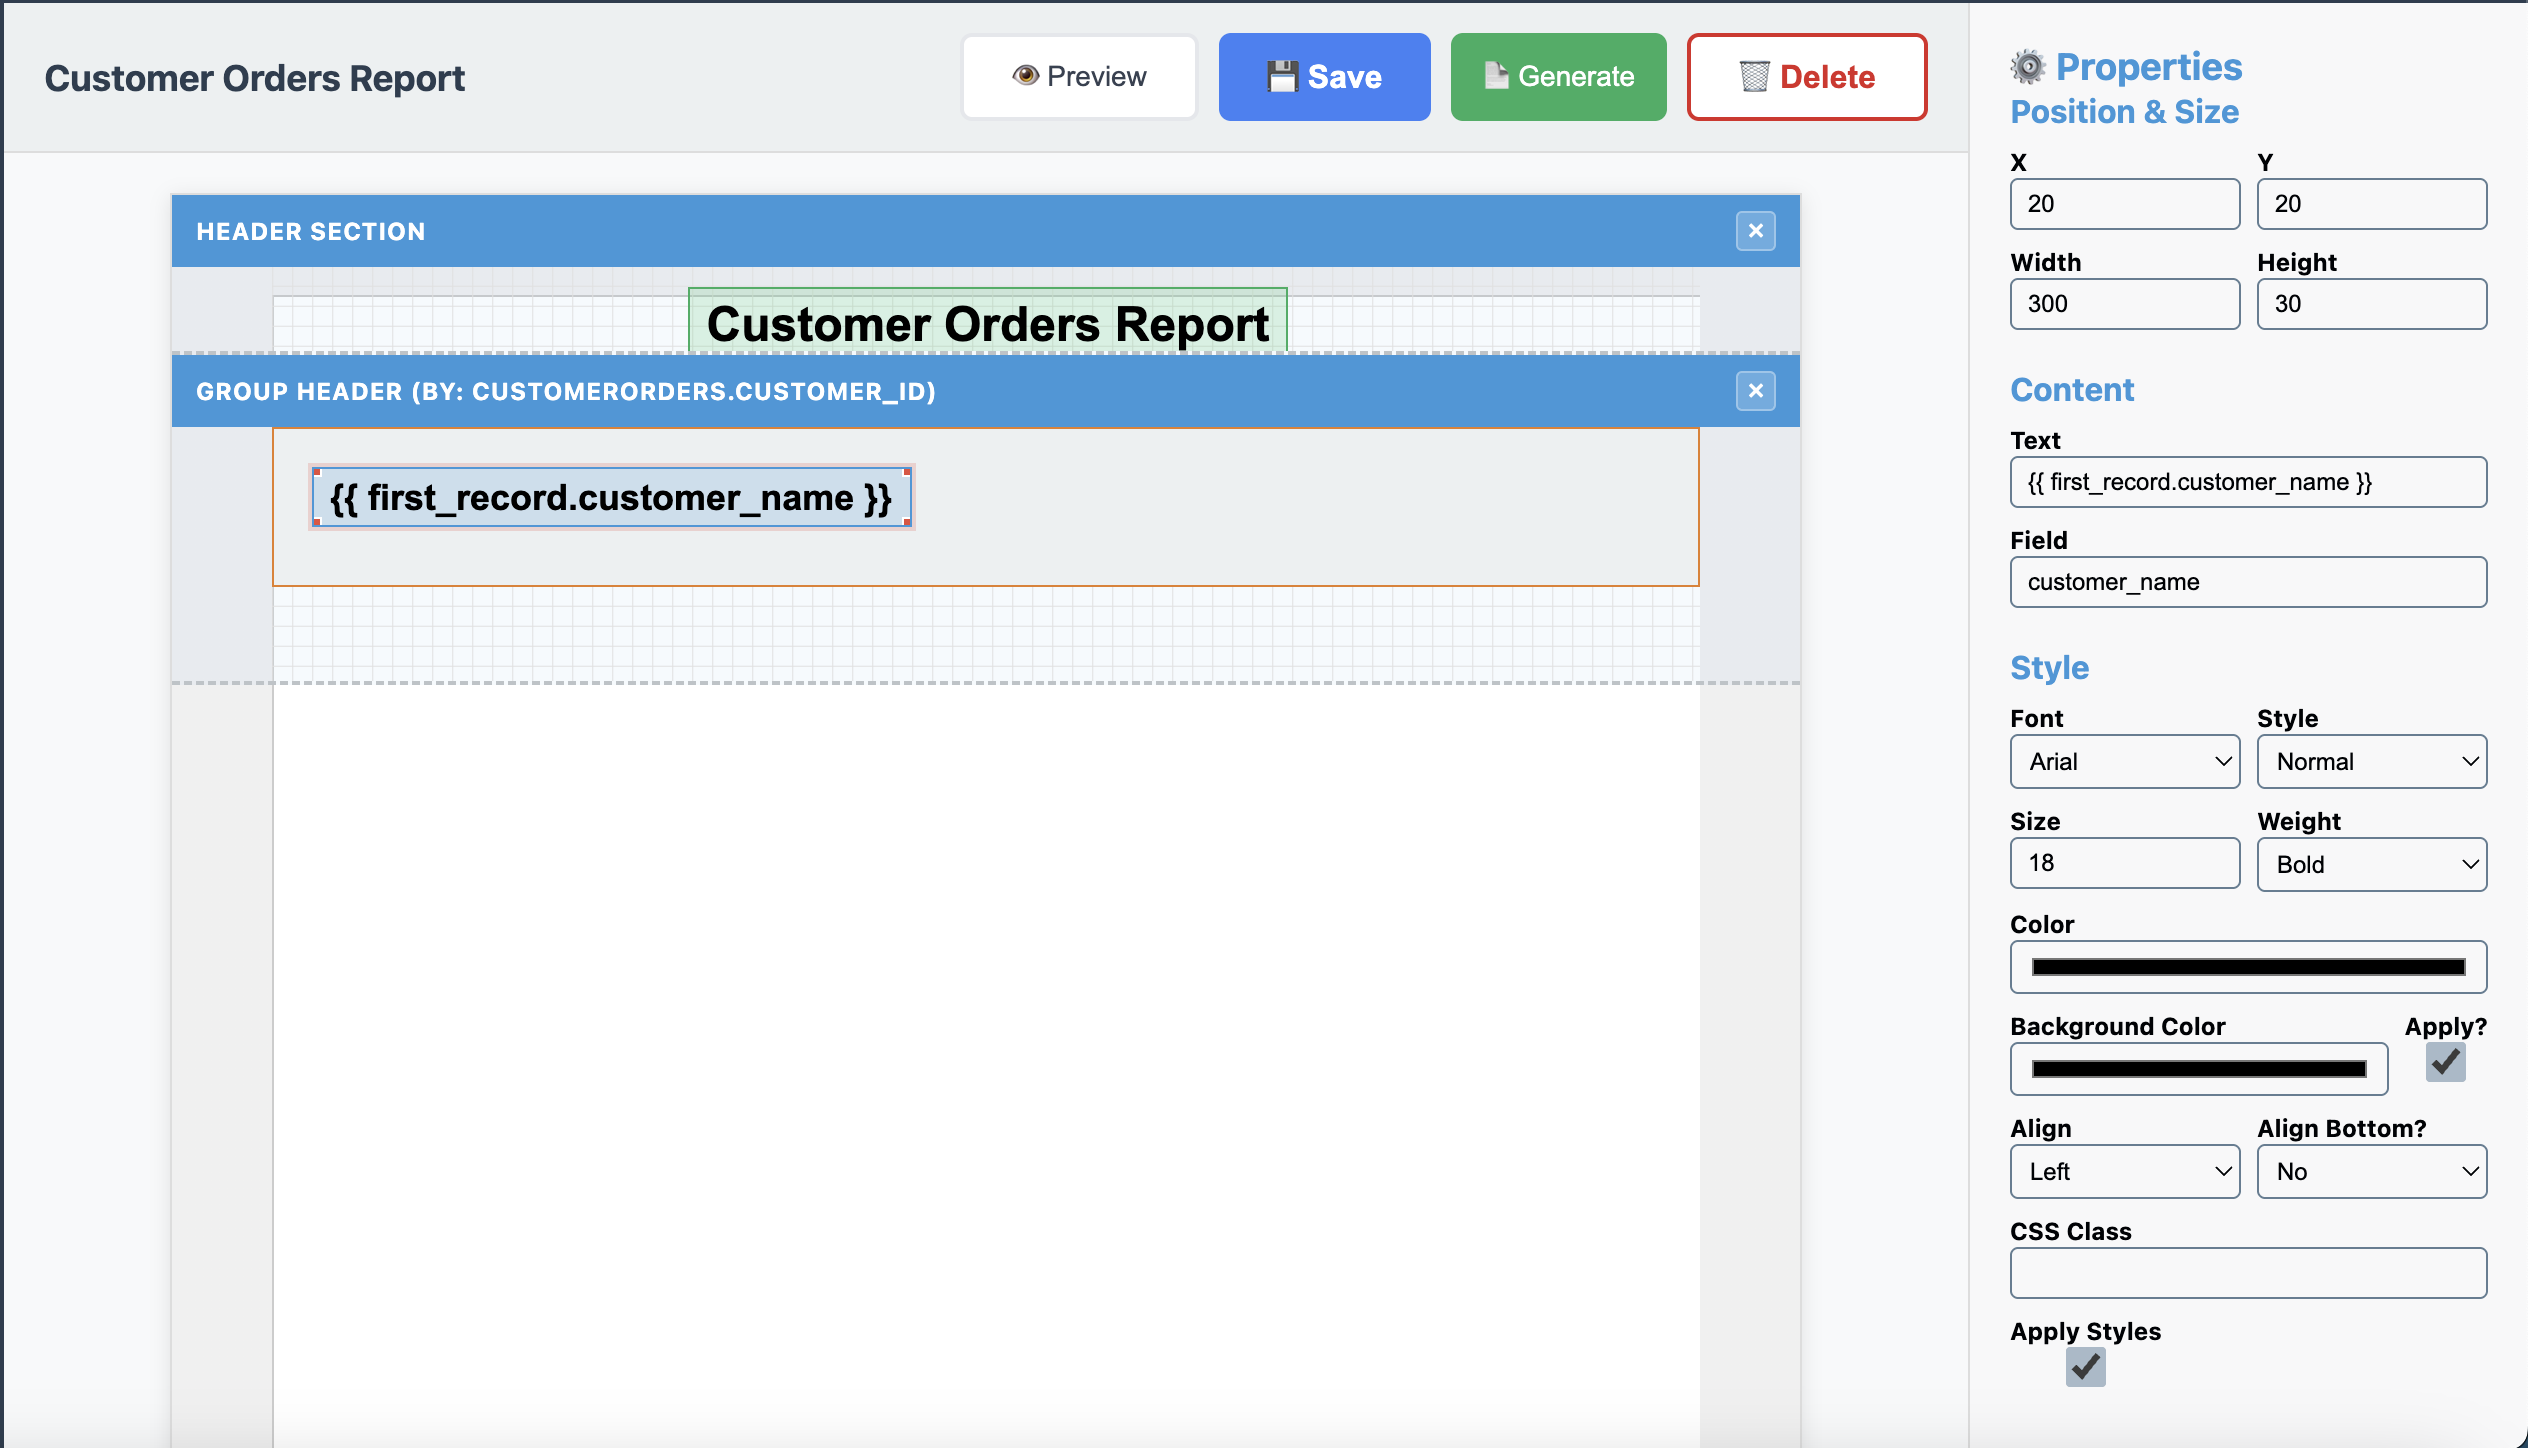
Add Customer Name
- From the Data Sources panel, drag “customer_name” field onto the group header
- Position it at the top left of the rectangle
- Set properties:
- X: 20
- Y: 20
- Width: 300
- Height: 30
- Font Size: 18px
- Font Weight: Bold
- Change the binding to:
{{ first_record.customer_name }}
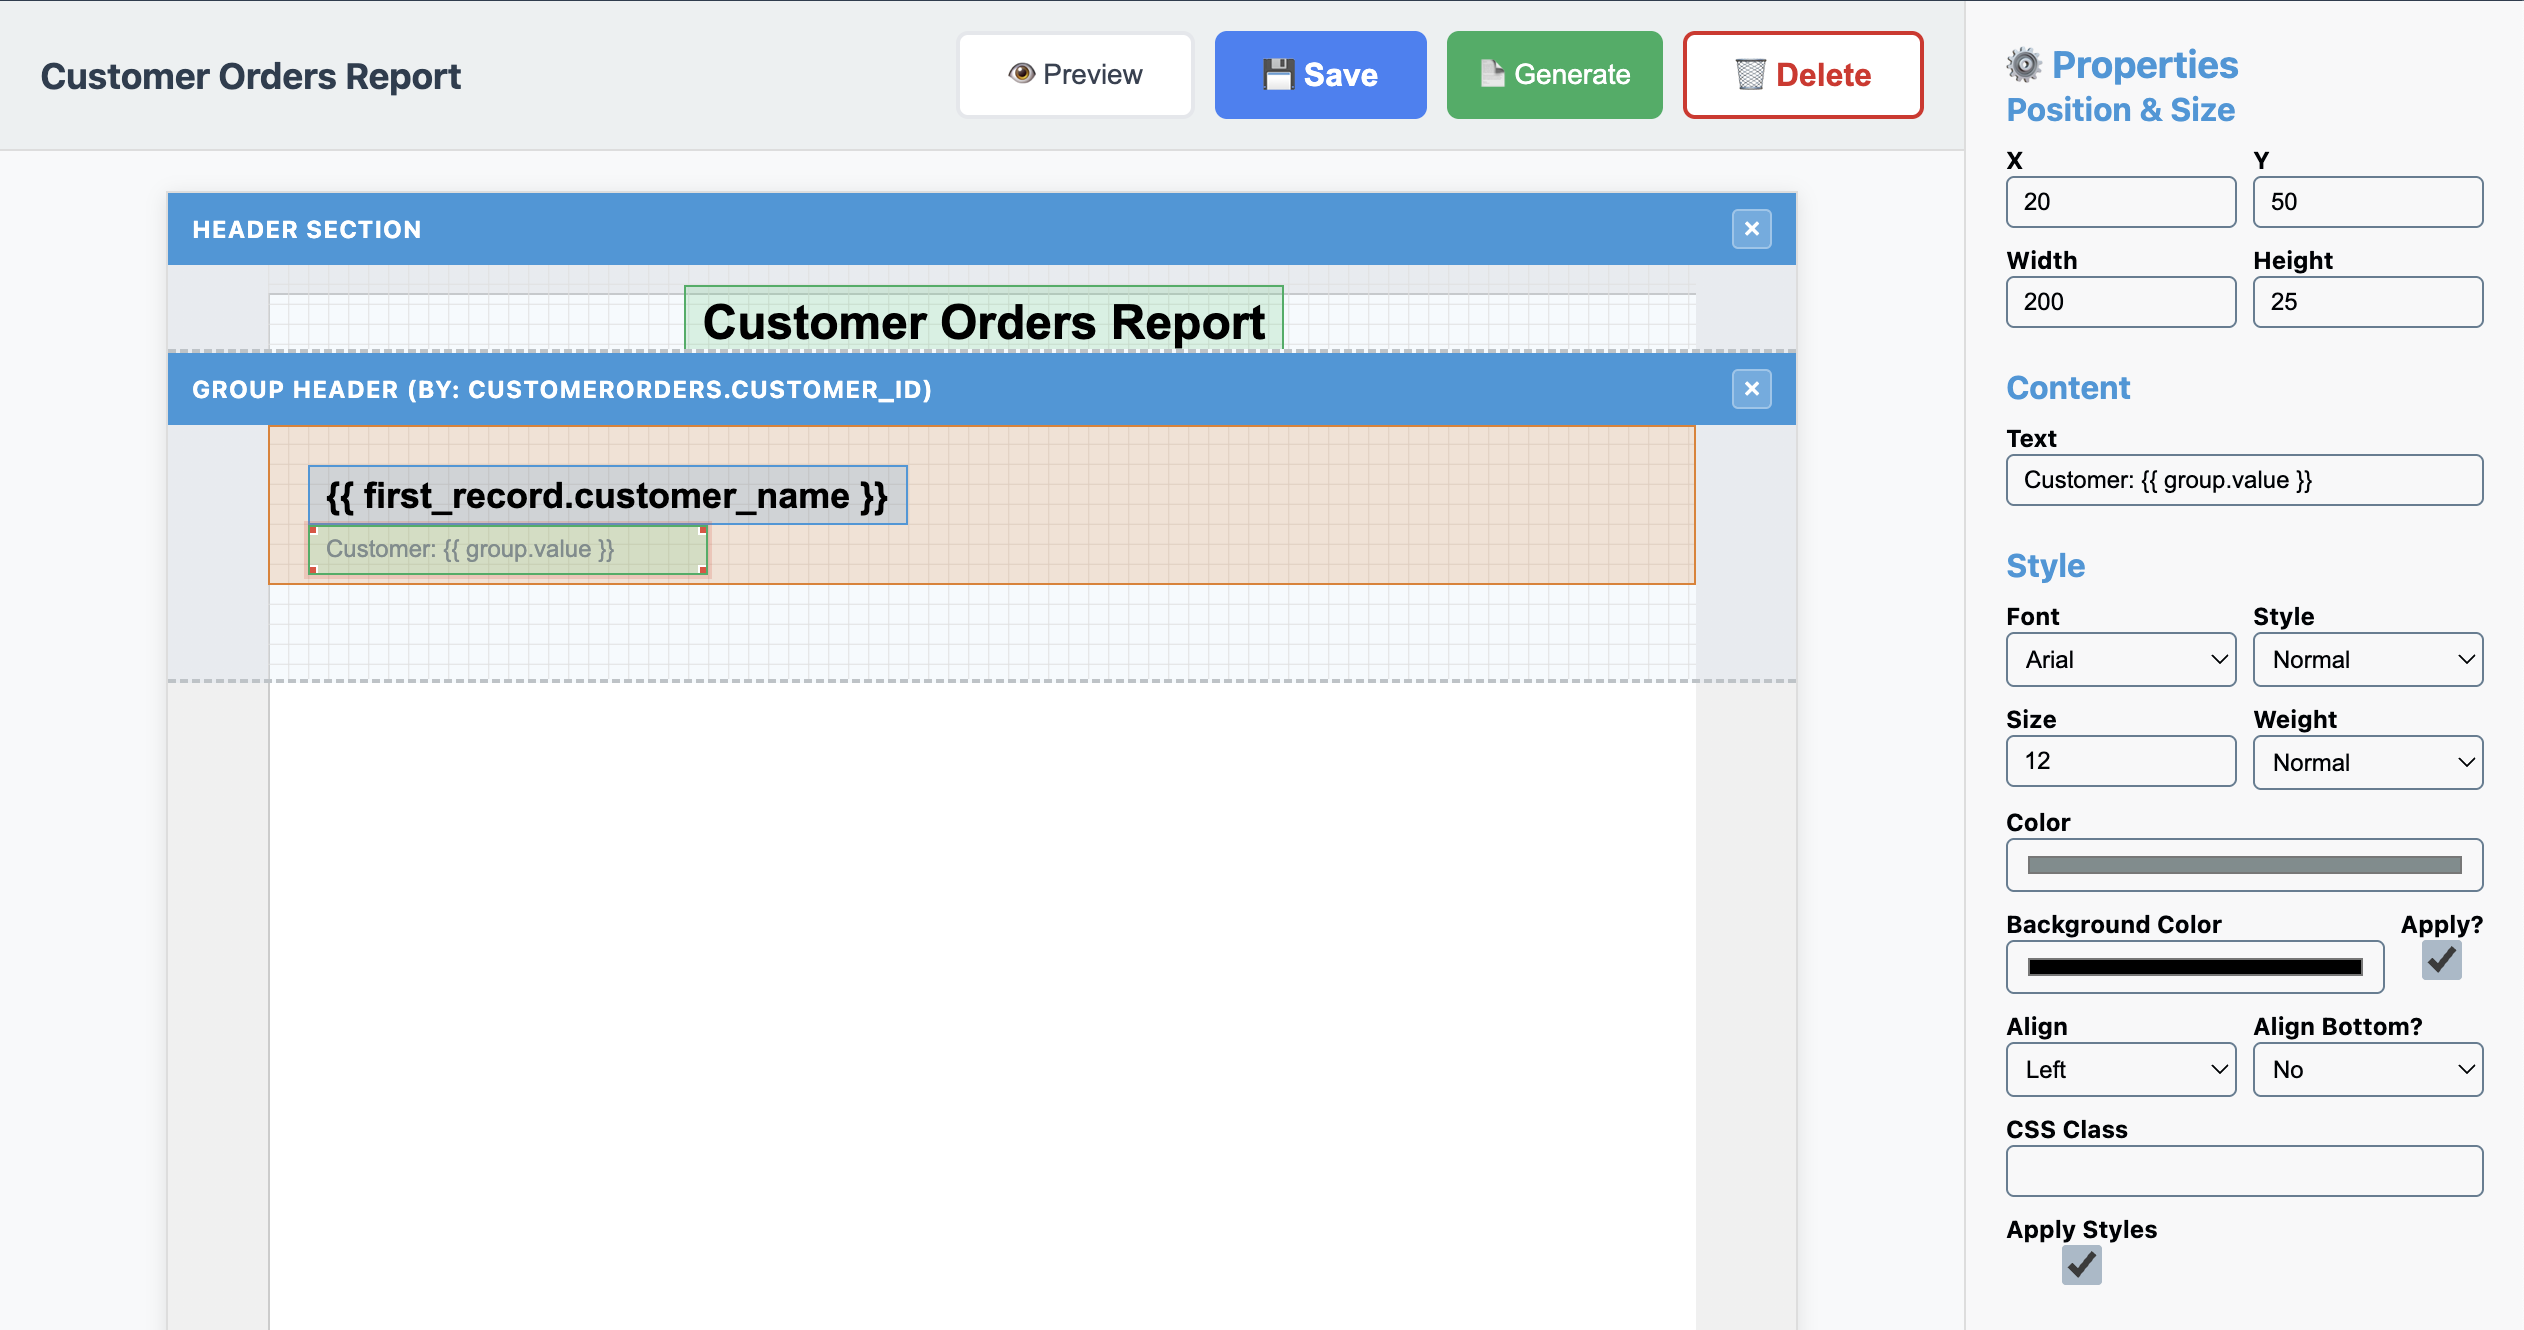
Add Customer group value
- Click the Text element and draw a rectangle under the “customer_name” field
- Set properties:
- X: 20
- Y: 50
- Width: 200
- Height: 25
- Font Size: 12px
- Color: #7f8c8d
- Binding:
Customer: {{ group.value }}
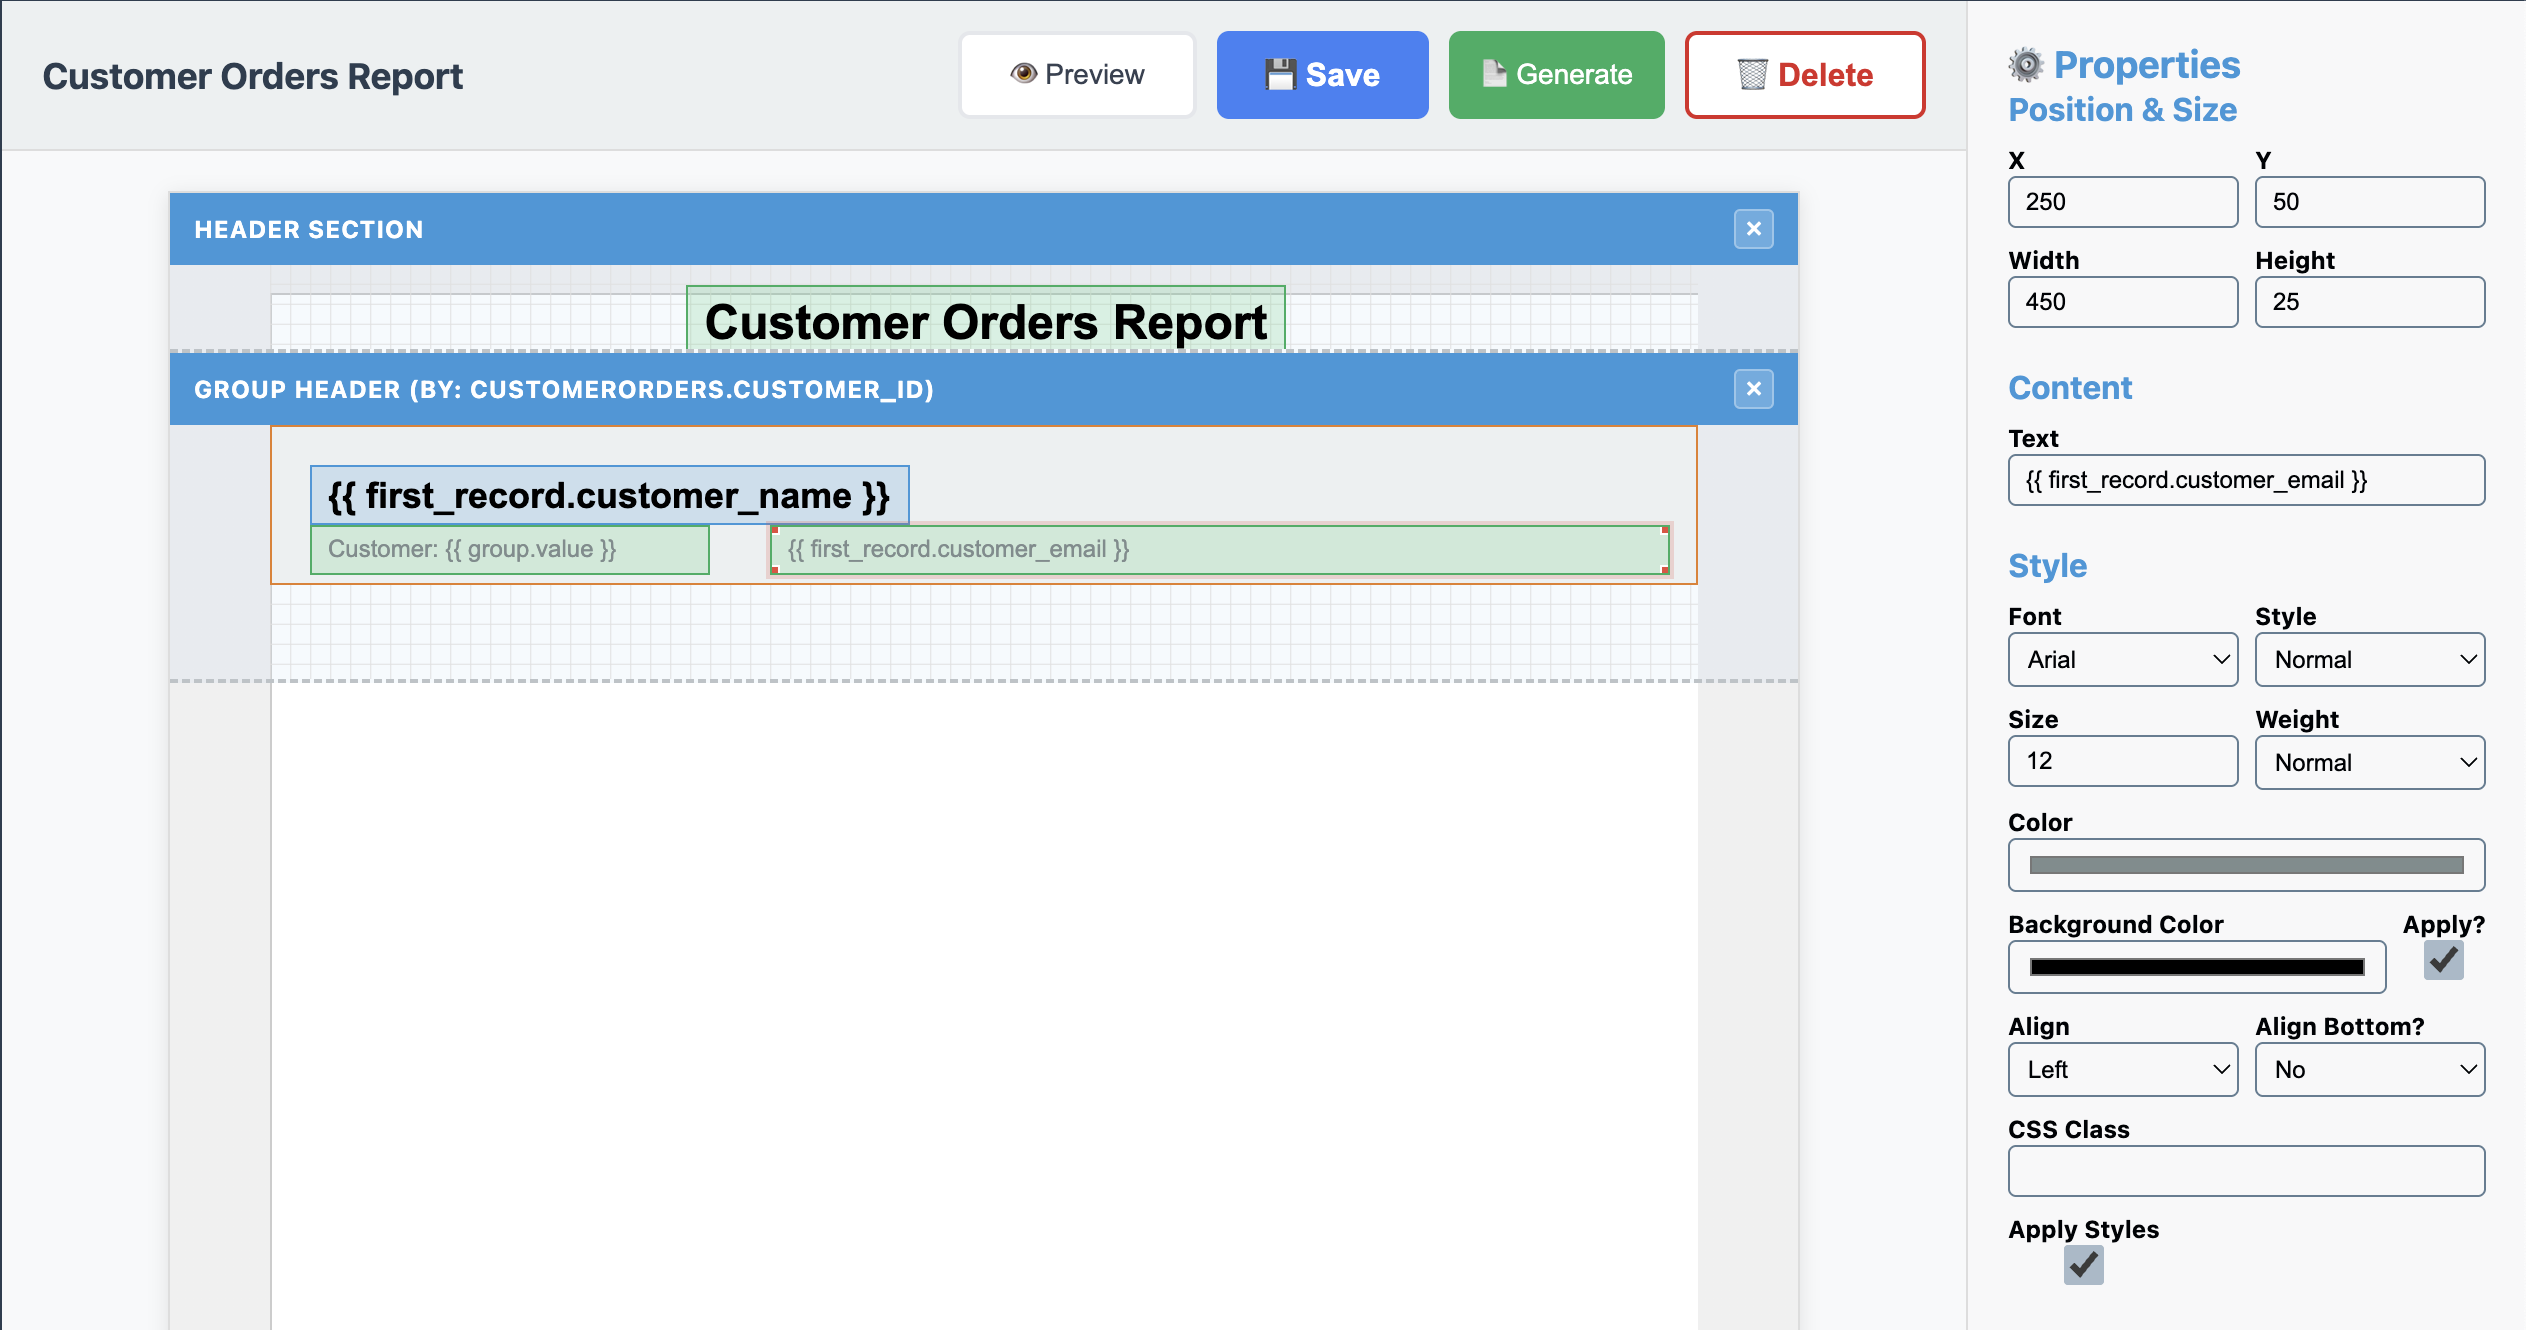
Add Customer Email
- Drag “customer_email” field below the customer name
- Set properties:
- X: 250
- Y: 50
- Width: 450
- Height: 25
- Font Size: 12px
- Color: #7f8c8d
- Binding:
{{ first_record.customer_email }}
Create Detail Section
Click on the Detail button under the Sections to add a Detail to the canvas
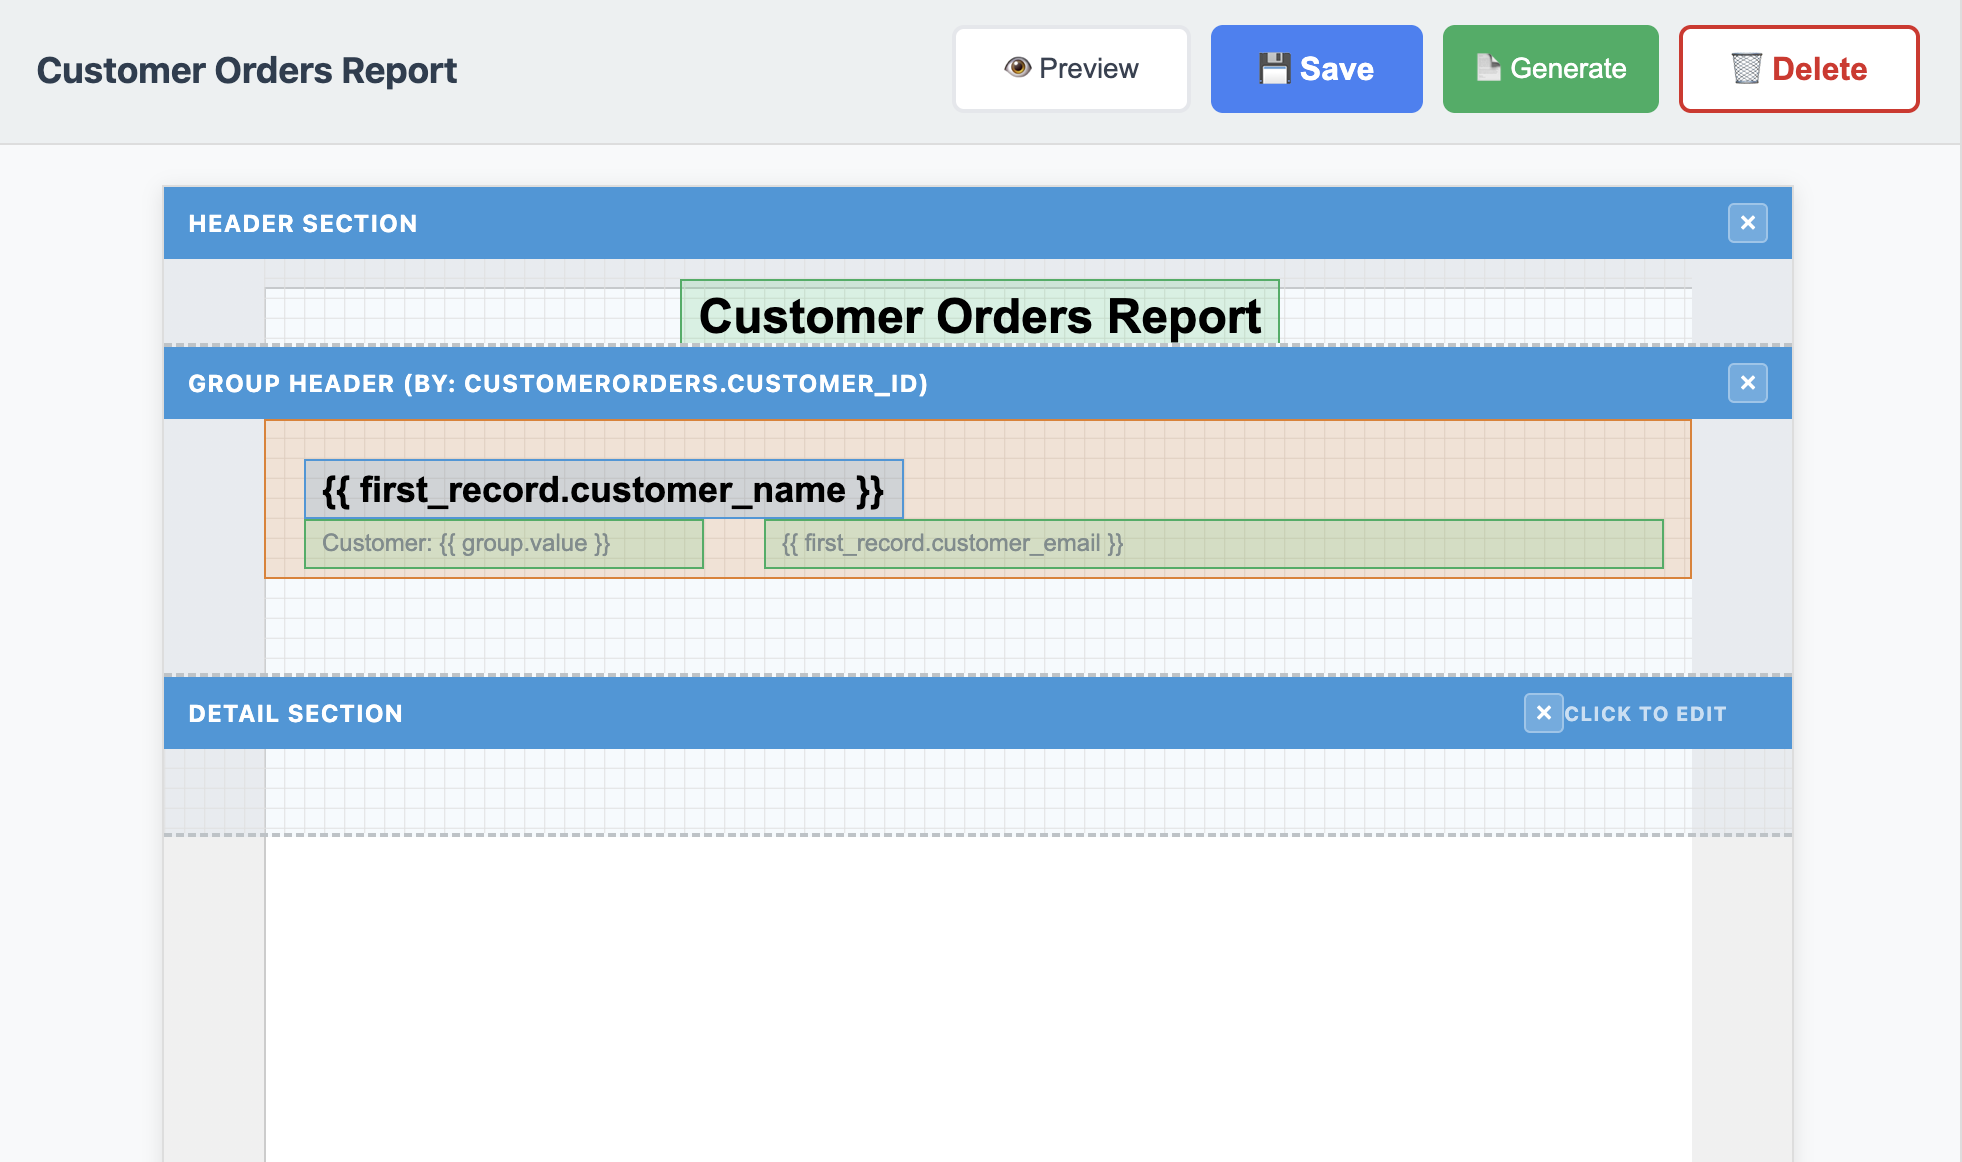
Note: We are going to create the Detail fields and then come back and add the column headers afterwards.
Step 5: Design the Detail Section
The detail section shows individual order rows.
[SCREENSHOT: Detail section with data fields being arranged]
- Make sure you’re working in the Detail section
- Drag these fields from the data source:
- order_id
- X: 20
- Y: 0
- Width: 100
- Height: 25
- order_date
- X: 140
- Y: 0
- Width: 120
- Height: 25
- product_name
- X: 280
- Y: 0
- Width: 140
- Height: 25
- quantity
- X: 440
- Y: 0
- Width: 120
- Height: 25
- Align: Right
- total
- X: 580
- Y: 0
- Width: 120
- Height: 25
- Align: Right
- order_id
- For the total field, update the binding to:
${{ record.total|floatformat:2 }} - Set all detail fields to:
- Font Size: 11px
- Color: #2c3e50
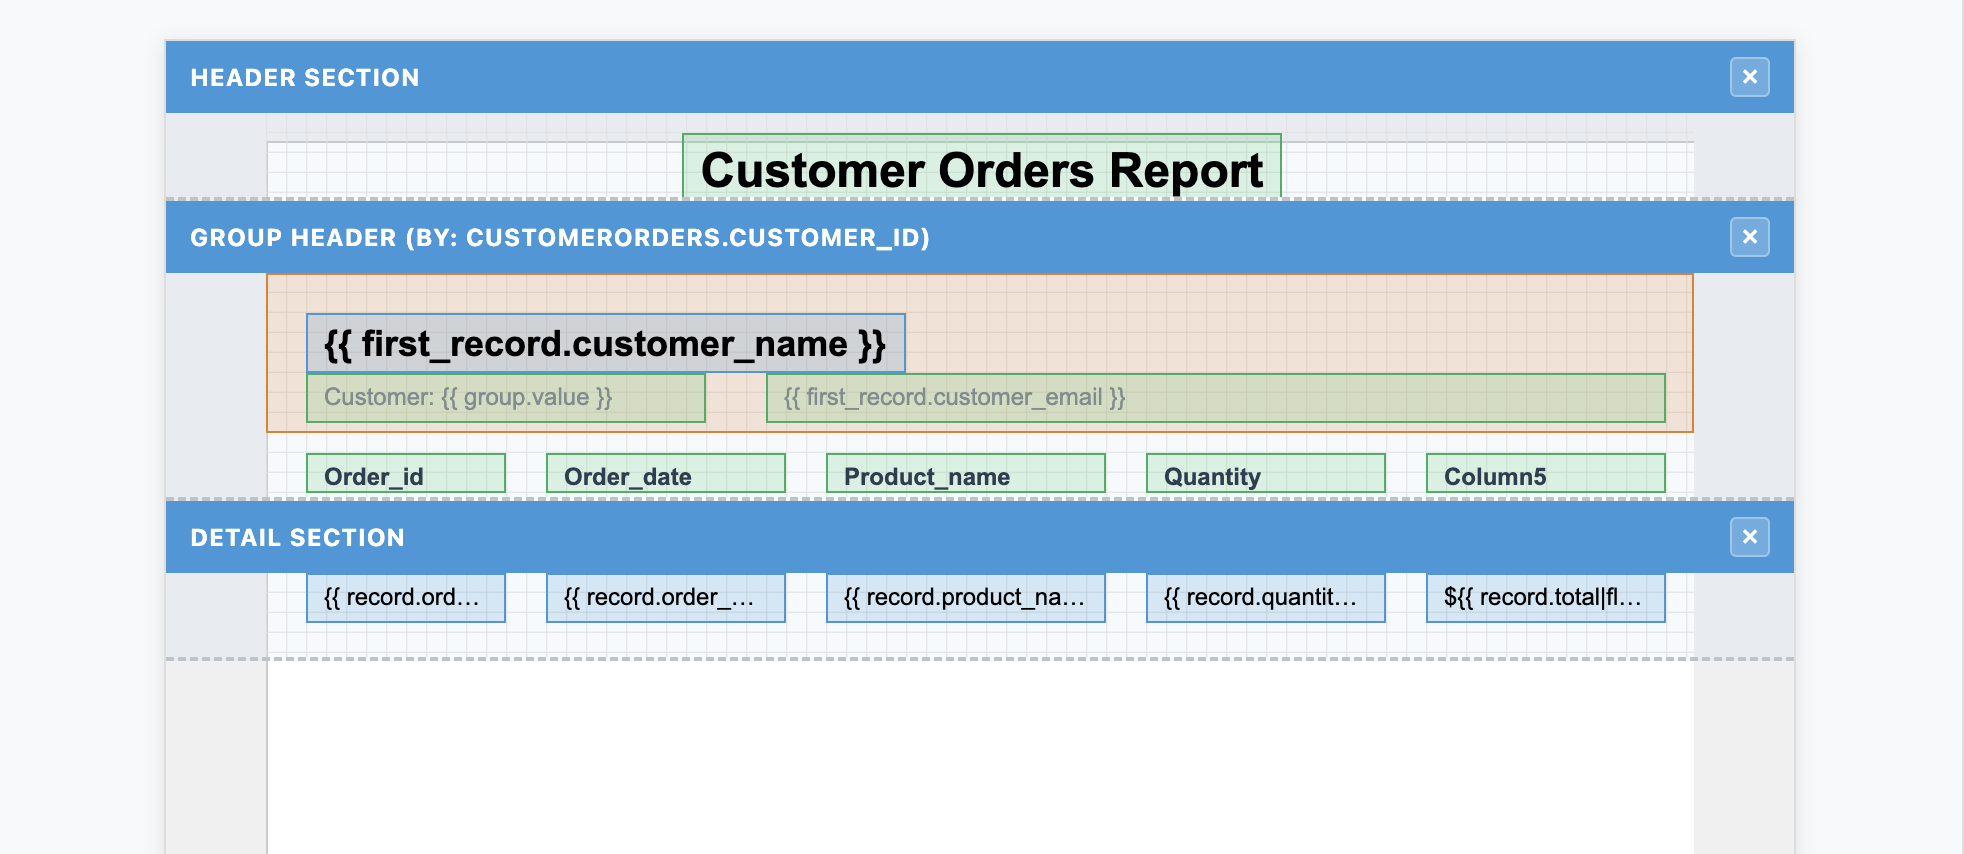
Step 6: Update Group Header
Create Column Headers
Under the Sections toolbar, click on the Generate Headers button.
- While holding down the ctrl/cmd key, left click each of the columns added and set the following:
- Align Bottom?: Yes
- Font Weight: Bold
- Font Size: 12px
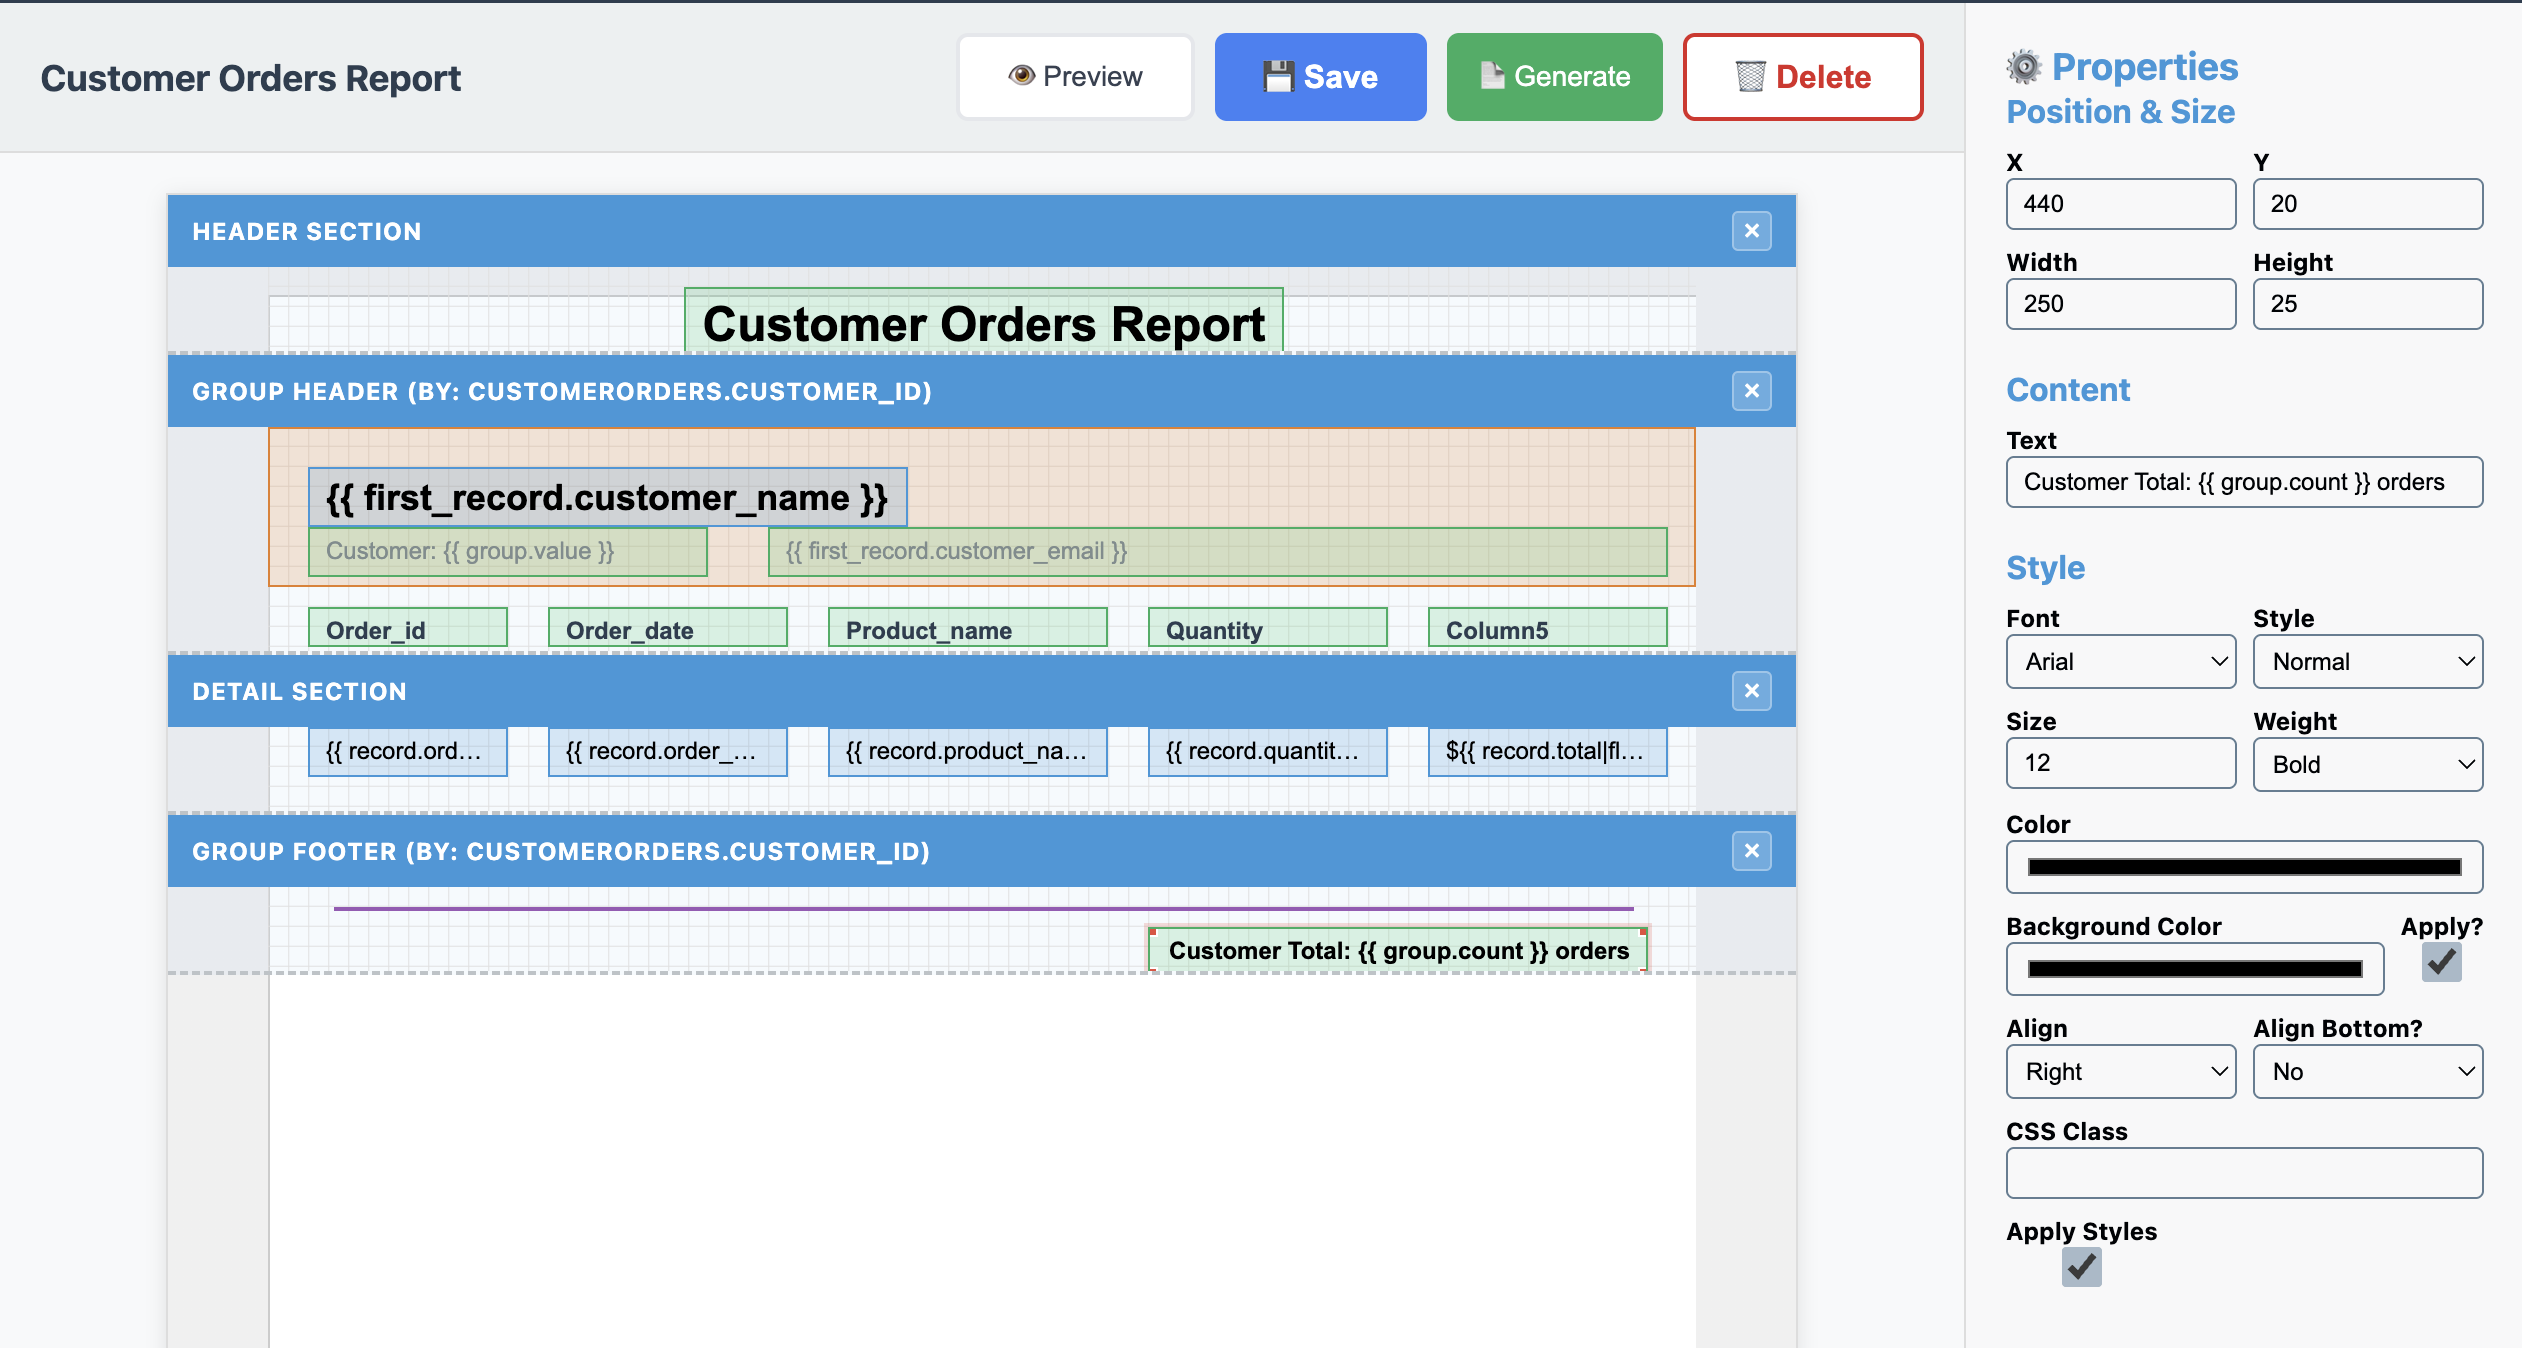
Step 7: Add the Group Footer
The group footer summarizes information for each customer.

- Click “Group Footer” in the Sections panel
- Select the same grouping field (customer_id)
- Add a line element at the top for visual separation
- Width: 650
- Height: 2
- Centered (by selecting the element and pressing the key “c”)
- Add a text element with:
- Text:
Customer Total: {{ group.count }} orders - Font Weight: Bold
- Align: Right
- Text:
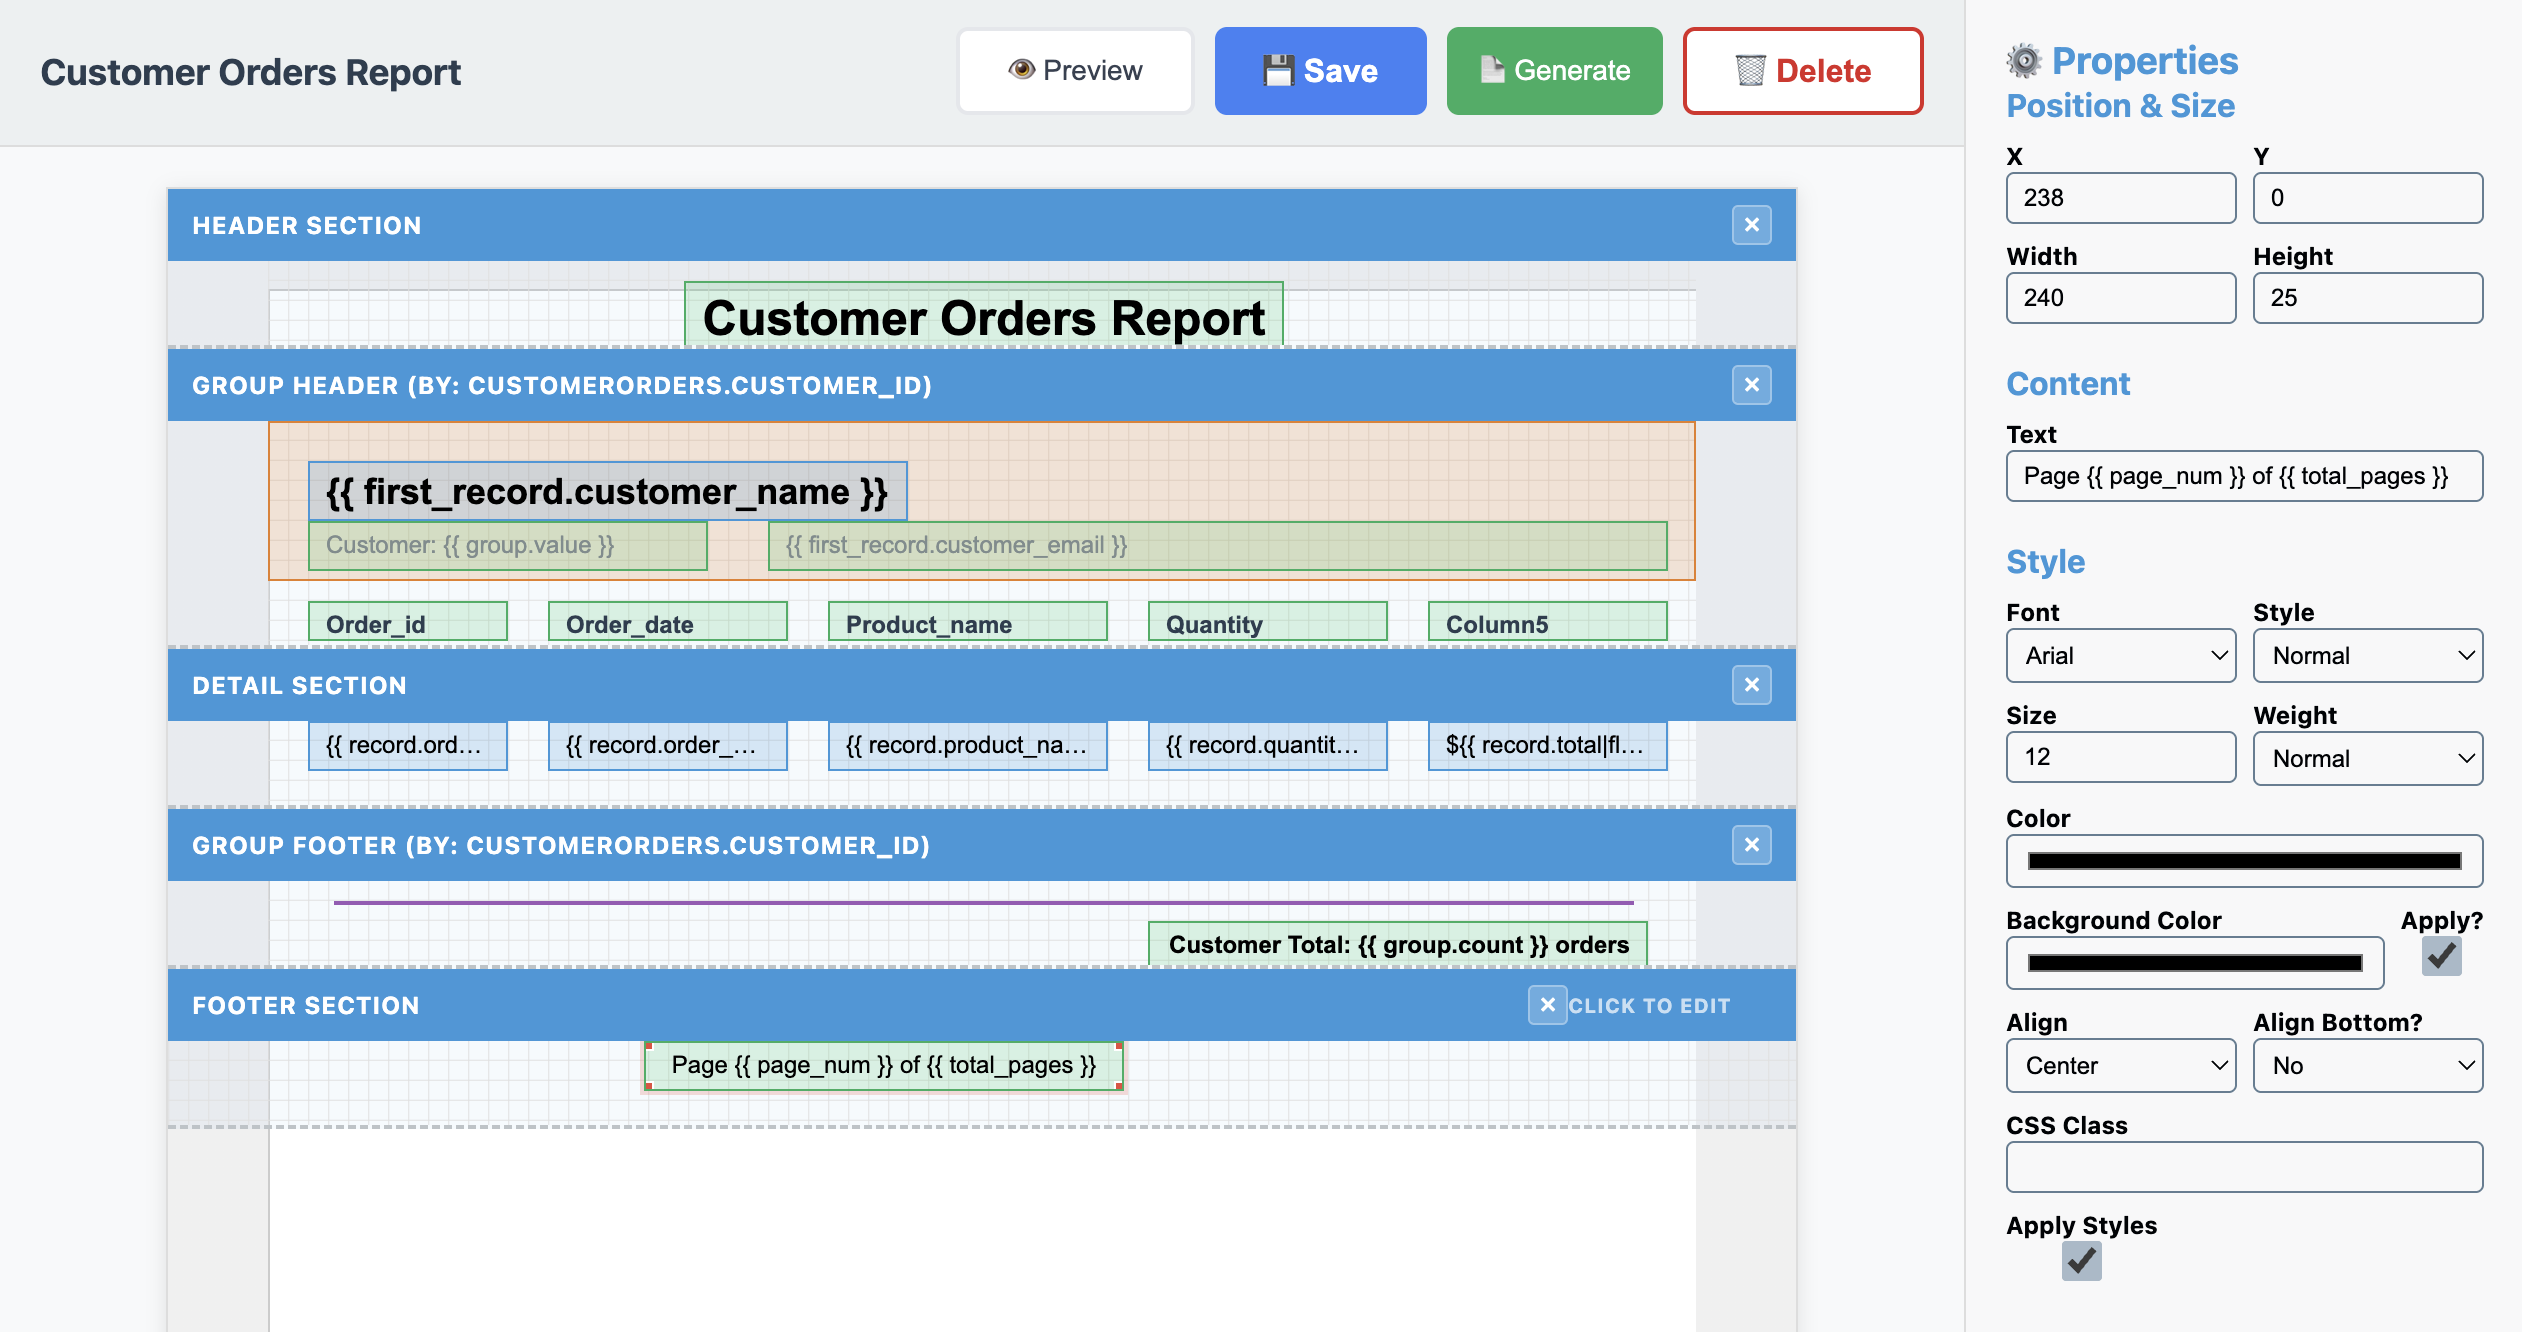
Step 8: Create the Page Footer

- Click “Footer” in the Sections panel
- Add a text element with:
- Width: 240
- Height: 25
- Text:
Page {{ page_num }} of {{ total_pages }} - Font Size: 12px
- Align: Center
- Centered (by selecting the element and pressing the key “c”)
Step 9: Generating your Report
Now for the exciting part - seeing your report in action!
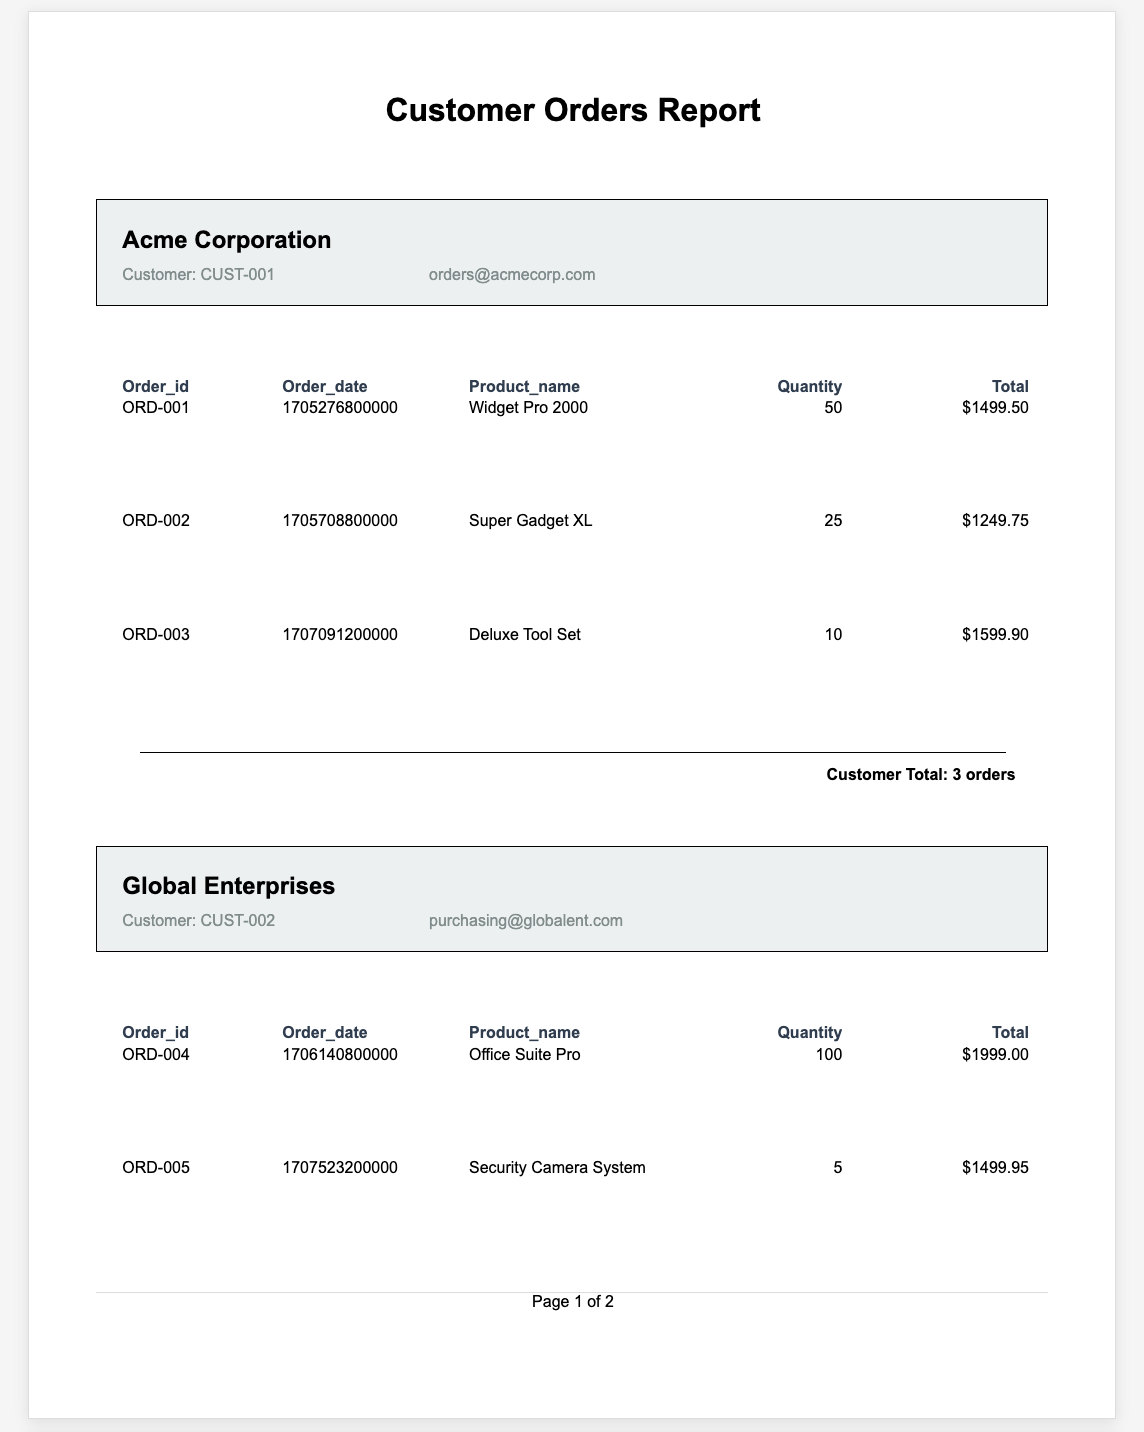
- Click the “Generate” button (📄)
- The generate window will show your report with the date from the data source
Step 10: Previewing your Report
Another feature is the ability to look at the layout of the report, prior to it being rendered with live data.
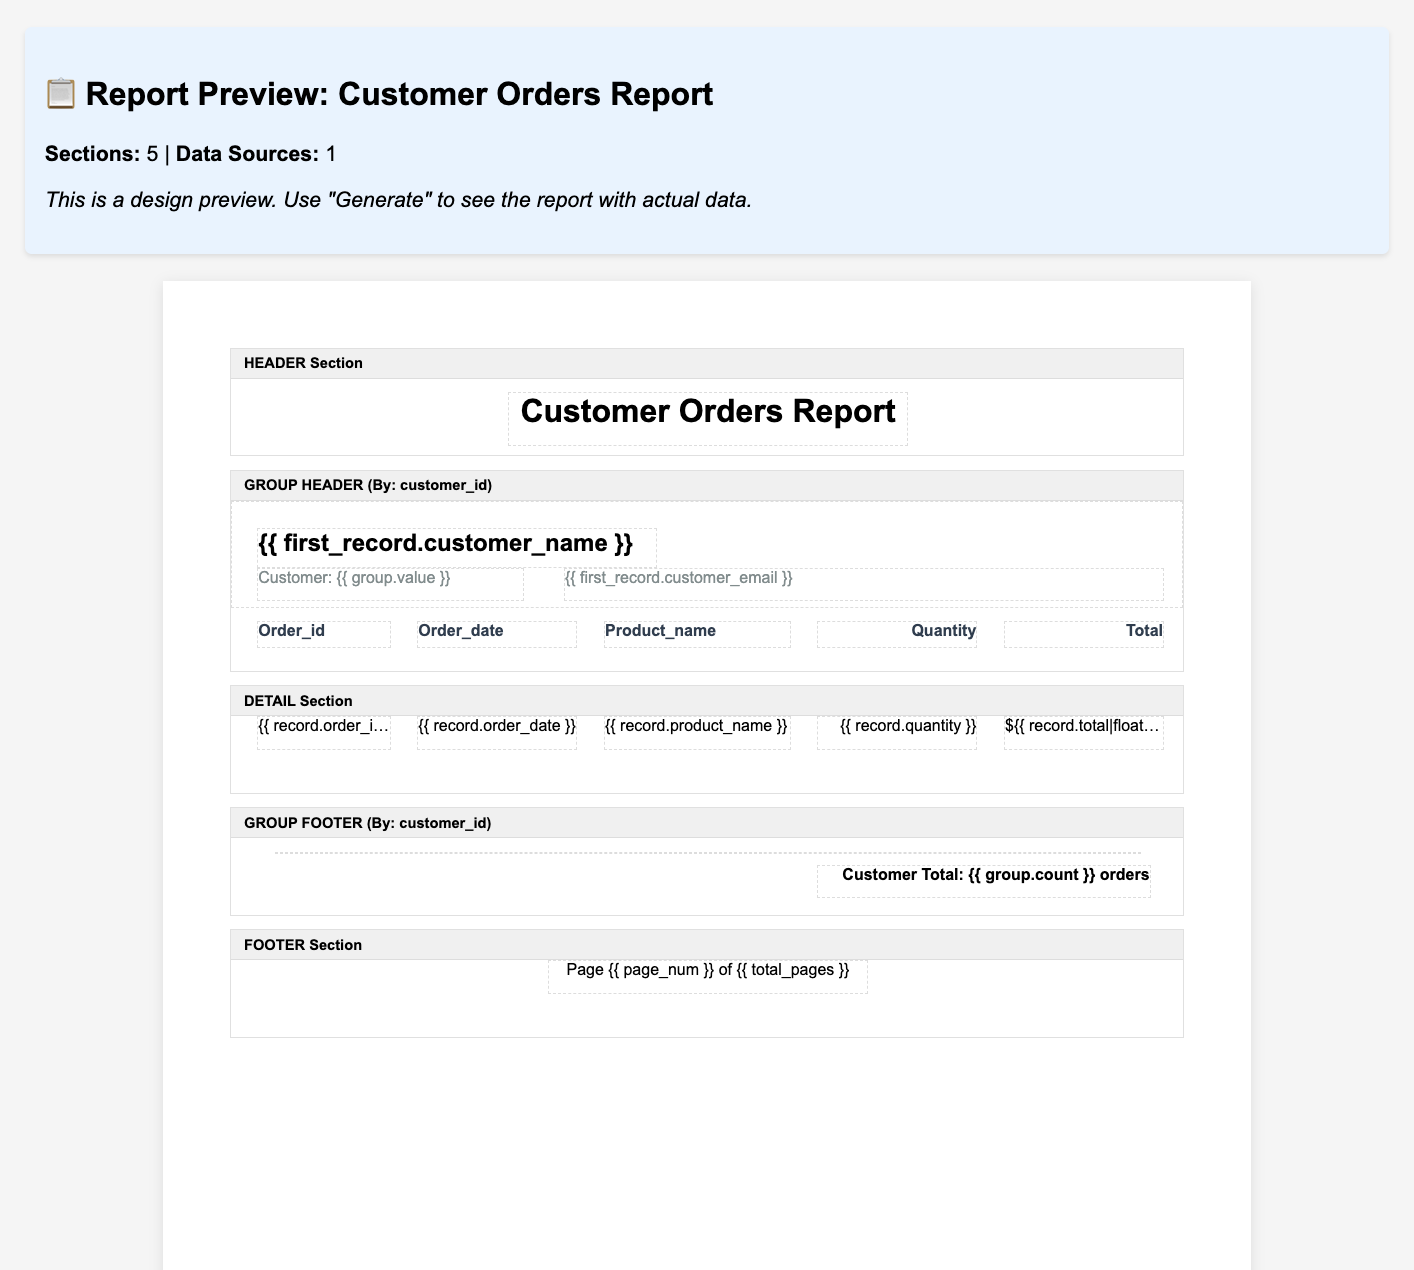
- Click the “Preview” button (👁️)
- The preview window will show your report with all the sections and placeholders where the data will be displayed.
Step 11: Fine-Tuning
Based on the preview, you might want to adjust: - Spacing between elements - Column widths for better data fit - Colors and fonts for better readability - Section heights to optimize page usage
[SCREENSHOT: Using the snap-to-grid feature to align elements perfectly]
Pro Tips: - Use the grid toggle (⊞) and snap-to-grid (🧲) for perfect alignment - Hold Shift while dragging to maintain aspect ratios - Use the properties panel to fine-tune exact positions
Step 12: Save

- Click “Save” (💾) to save your template
Note: You will want to save often so as not to lose anything!
Advanced Features to Explore
Once you’re comfortable with the basics, try these advanced features:
Conditional Formatting
Highlight orders over a certain amount:
{{ record.total > 100 ? 'high-value' : '' }}
Calculated Fields
Add running totals or percentages in your group footers
Multiple Grouping Levels
Group by customer, then by order date for more complex reports
Custom Styling
Use the Custom CSS section to add your brand colors and fonts
Conclusion
Congratulations! You’ve created a professional master-detail report without writing a single line of code. The visual designer makes it easy to create complex layouts while the template engine handles all the data processing and grouping logic.
This same approach can be used for:
- Invoice generation
- Inventory reports
- Sales summaries
- Employee timesheets
- And much more!
Next Steps
- Explore Templates: Check out our template library for more examples
- Learn Data Sources: Connect to different databases and APIs
- Master Expressions: Learn about advanced template expressions
- Share Your Reports: Set up automated report generation and distribution
Happy reporting! If you have questions or want to share your creations, join our community forum or reach out to support.
Ready to create your own reports? Start your free trial and build beautiful reports in minutes, not hours.